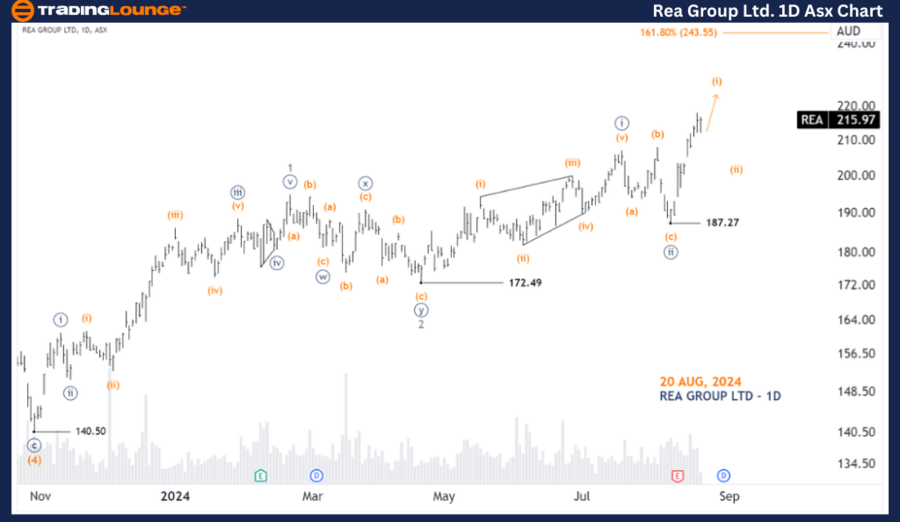
ASX: REA GROUP LTD – REA Elliott Wave Technical Analysis (1D Chart)

Greetings, today's Elliott Wave analysis provides an update on REA GROUP LTD (ASX: REA) on the Australian Stock Exchange. Our analysis suggests that REA.ASX may experience a rise, driven by wave ((iii))-navy development.

ASX: REA GROUP LTD – REA Elliott Wave Technical Analysis

ASX: REA GROUP LTD – REA 1D Chart (Semilog Scale) Analysis

Function: Major Trend (Minor degree, gray)

Mode: Motive

Structure: Impulse

Position: Wave (i)-orange of Wave ((iii))-navy

Details: Wave ((iii))-navy is currently unfolding, signaling a potential upward movement. This wave is subdividing into wave (i)-orange, which is expected to push higher. A significant decline following this movement may indicate the onset of wave (ii)-orange, suggesting a potential downward correction before wave (iii)-orange resumes its upward trajectory.

Invalidation Point: 187.27

Rea-Group-ltd-1D-Asx...


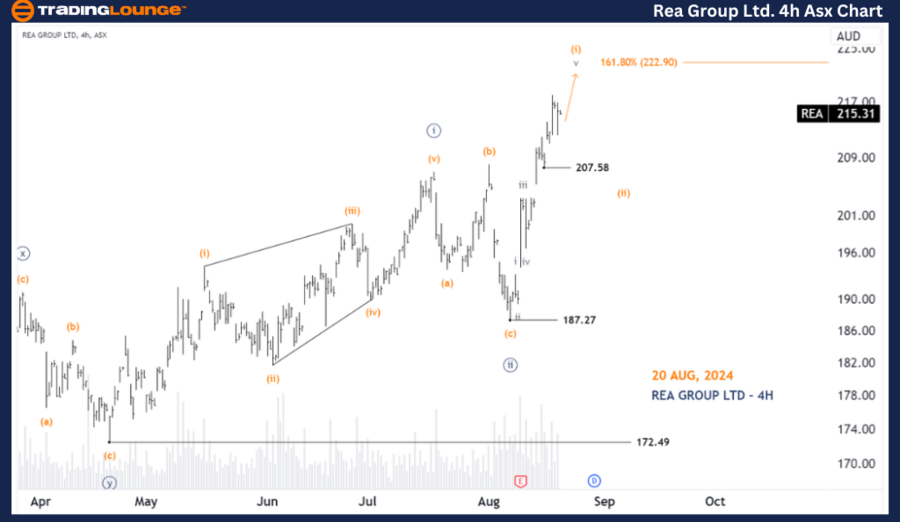
ASX: REA GROUP LTD – REA Elliott Wave Analysis (4-Hour Chart)

ASX: REA GROUP LTD – REA 4-Hour Chart Analysis

Function: Major Trend (Minute degree, navy)

Mode: Motive

Structure: Impulse

Position: Wave (i)-orange of Wave ((iii))-navy

Details: Since reaching the low of 172.49, waves ((i)) and ((ii))-navy have completed their formation. The ((iii))-navy wave has begun developing from the low of 187.27, which is subdividing into the (i)-orange wave. This wave is expected to push slightly higher, potentially targeting the 222.90 level. However, given the considerable progress of the (i)-orange wave, it may conclude at any point. A drop below the 207.58 level would indicate the beginning of the (ii)-orange wave.

Invalidation Point: 187.27

Technical Analyst: Hua (Shane) Cuong, CEWA-M (Master’s Designation).

Source: visit Tradinglounge.com and learn From the Experts Join TradingLounge Here 

Previous:  WiseTech Global Limited (WTC) Elliott Wave Technical Analysis

Special Trial Offer - 0.76 Cents a Day for 3 Months! Click here

Access 7 Analysts Over 200 Markets Covered. Chat Room With Support


Rea-Group-ltd-4H-Asx...


Conclusion

Our Elliott Wave analysis of ASX: REA GROUP LTD (REA) aims to provide valuable insights into current market trends and strategies to capitalize on them. We offer specific price points that serve as validation or invalidation signals for our wave count, enhancing confidence in our analysis. By integrating these elements, we aim to deliver an objective and professional perspective on the market trends affecting REA.ASX.

Related

Costco Wholesale Corp.(COST:NASDAQ) Elliott Wave Technical Analysis 7 November 23

Costco Wholesale Corp.(COST:NASDAQ) Elliott Wave Technical Analysis 7 November 23

Costco Wholesale Corp.(COST:NASDAQ) Elliott Wave Technical Analysis on 7 November 23, COST Stock Mar...

Read More >
HDFC Bank Stock Analysis: Elliott Wave, Daily and 4H Chart Insights, Key Resistance Levels, and Future Predictions

HDFC Bank Stock Analysis: Elliott Wave, Daily and 4H Chart Insights, Key Resistance Levels, and Future Predictions

This article provides a comprehensive Elliott Wave analysis of HDFC Bank's stock, featuring insi...

Read More >
TCS Stock Elliott Wave Analysis Shows Bullish Impulse with Wave 1 Rising – Forecasting Higher Share Price and Trend Continuation

TCS Stock Elliott Wave Analysis Shows Bullish Impulse with Wave 1 Rising – Forecasting Higher Share Price and Trend Continuation

Detailed Elliott Wave analysis of TCS stock reveals a bullish impulsive structure on both daily and ...

Read More >
Our technical analysis of the DAX (Germany) Index highlights Trading Strategies | DAX Elliott Wave Analysis

Our technical analysis of the DAX (Germany) Index highlights Trading Strategies | DAX Elliott Wave Analysis

Discover a detailed DAX Elliott Wave analysis that delves into the current market trends and forecas...

Read More >
Following DAX Index News: DAX 40 Stocks Elliott Wave Analysis with Daily and Weekly Chart Forecasts, Technical Outlooks

Following DAX Index News: DAX 40 Stocks Elliott Wave Analysis with Daily and Weekly Chart Forecasts, Technical Outlooks

DAX 40 Elliott Wave analysis covers both daily and weekly chart forecasts. It includes technical out...

Read More >
WTI CrudeOil - Commodities Analysis & Elliott Wave Technical Forecast with price trends Analysis

WTI CrudeOil - Commodities Analysis & Elliott Wave Technical Forecast with price trends Analysis

This comprehensive analysis provides an in-depth look into the WTI crude oil market, utilizing the E...

Read More >

$1 for 2 Weeks

then $29 a month!

What a Special Offer!

Trade Recommendations

Unleash the power of deversified trading with our comprehensive portfolio, covering 250+ markets:

  • Stock Trades
  • Crypto Trades
  • Forex Trades
  • Commodity Trades
Elliott Wave Analysis

Gain a competitive edge with expert insights and AI-powered Elliott Wave charting into:

  • Global Indices
  • US Stocks & ASX Stocks
  • Forex & Crypto
  • Commodities
Top-Notch Trading Tools

Equip yourself with the tools of success:

  • Real-time Chat rooms
  • Elliott Wave Algorithm
  • Portfolio tools
  • TradingLevels
  • Screener
  • Trading Game
7 Elliott Wave Analysts

Stay ahead of the market with daily charts and insightful videos
Your secret to strategic trading!

JOIN HERE


Welcome to TradingLounge (ASIC A.R.No. 321187), specialists in trades, trading education and technical analysis, covering stocks, indices, commodities, forex and cryptocurrencies.

When you join TradingLounge you have access to everything we offer, including trade tools, educational content and a social platform to chat with like-minded investors.

Read more

@Copyright 2024 by tradinglounge.com

Contact Us

Australian no: 02 4787 6020

International no: +61 (2) 47876020

Pay with:

Find us on