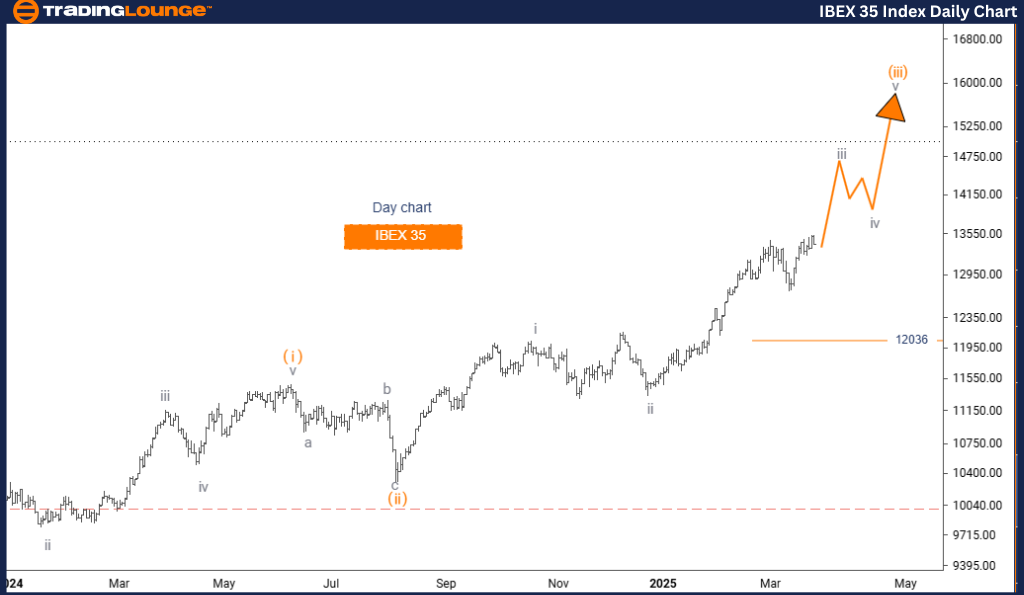
IBEX 35 (Spain) Elliott Wave Analysis – TradingLounge Daily Chart
IBEX 35 (Spain) Wave Technical Analysis
Function: Bullish Trend
Mode: Impulsive
Structure: Gray Wave 3
Position: Orange Wave 3
Next Lower Degree Direction: Gray Wave 4
Wave Cancel Invalid Level: 12036
The daily chart of IBEX 35, Spain's primary stock index, continues to reflect a bullish Elliott Wave structure. Currently, the market is progressing through gray wave 3, which belongs to the broader orange wave 3 sequence—signaling a robust impulsive trend.
Following the completion of gray wave 2’s correction, the index is now moving strongly within gray wave 3—usually the longest and most forceful part of an Elliott Wave cycle. This progression indicates high upside potential for IBEX 35 in the short term.
Key Level to Watch
- Invalidation Level: 12036
A decline below this critical support level would invalidate the current bullish structure, triggering a reassessment of the wave count.
This stage presents an ideal scenario for traders focused on wave dynamics. Gray wave 3's ongoing momentum could be validated through increased volume, aggressive price action, and strong upward momentum. After this phase, gray wave 4 is expected to provide a corrective pullback before the broader uptrend resumes.
The alignment of wave degrees is important here. Gray wave 3 serves as a near-term trading driver and a key segment of the overall orange wave 3 structure. Observing classic impulsive traits will help traders confirm this wave’s integrity.
Trading Insight
Maintaining long positions in IBEX 35 remains favorable, with strategic risk management around 12036 crucial to safeguard capital. This setup aligns with a bullish IBEX 35 forecast supported by technical wave analysis.
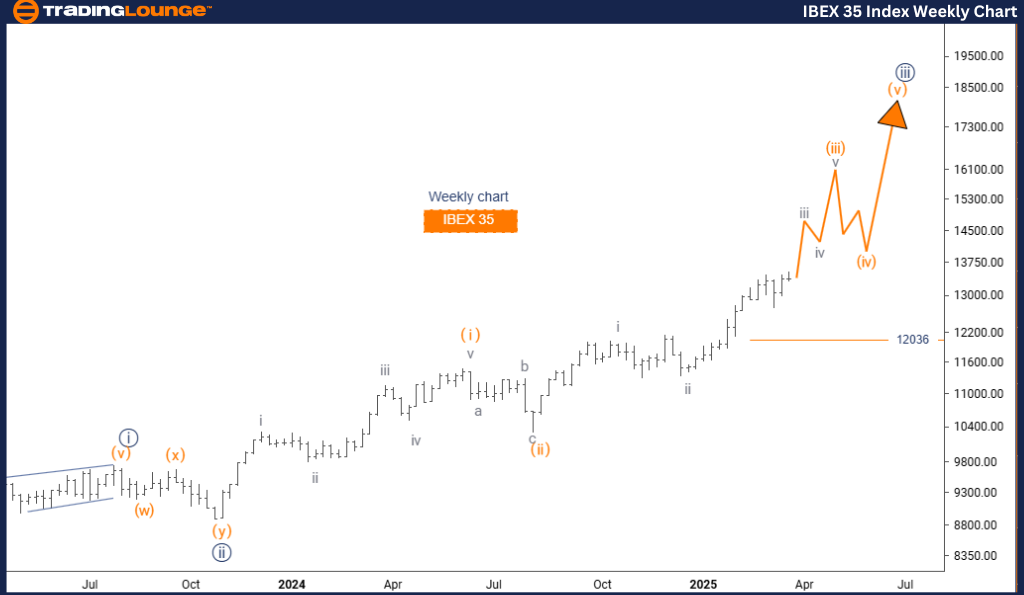
IBEX 35 (Spain) Elliott Wave Analysis – TradingLounge Weekly Chart
IBEX 35 (Spain) Wave Technical Analysis
Function: Bullish Trend
Mode: Impulsive
Structure: Orange Wave 3
Position: Navy Blue Wave 3
Next Lower Degree Direction: Orange Wave 4
Wave Cancel Invalid Level: 12036
The weekly IBEX 35 Elliott Wave chart supports a strong long-term bullish outlook. The index is currently in the development phase of orange wave 3, embedded within the broader navy blue wave 3 formation.
With orange wave 2 confirmed as completed, the bullish wave cycle has moved into orange wave 3, typically characterized by heightened price acceleration and trend clarity. This structure suggests sustained upward movement and positive momentum for IBEX 35.
Key Level to Watch
- Invalidation Level: 12036
Falling below this key level would negate the current Elliott Wave structure, requiring a reanalysis of market position.
This weekly wave analysis offers an expanded view into both medium and long-term trading strategies. The active phase of orange wave 3 within navy blue wave 3 represents a solid upward segment. Confirmation signals such as increasing volume and persistent rallies can reinforce this bullish IBEX 35 analysis.
Understanding the relationship between wave degrees is essential. Orange wave 3 is not only a standalone opportunity but also part of a larger wave pattern pointing toward long-term gains. Traders and investors should monitor for strong impulsive signals during this phase.
Trading Insight
The ongoing bullish trend in IBEX 35 supports holding positions aligned with market strength. Protecting downside risk, particularly near the 12036 threshold, is essential. The weekly chart delivers valuable perspective for both short-term entries and long-term positioning strategies in the Spanish stock market.
Technical Analyst: Malik Awais
Source: visit Tradinglounge.com and learn From the Experts Join TradingLounge Here
Previous: S&P BSE Sensex (India) Elliott Wave Technical Analysis
VALUE Offer - Buy 1 Month & Get 3 Months!Click here
Access 7 Analysts Over 200 Markets Covered. Chat Room With Support