EURUSD Elliott Wave Analysis - Trading Lounge Day Chart
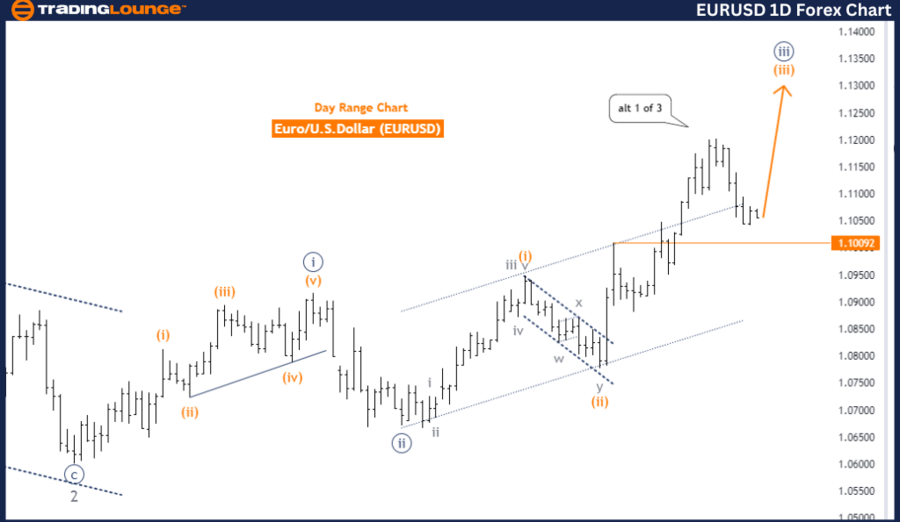
Euro/U.S. Dollar (EURUSD) Day Chart Analysis
EURUSD Elliott Wave Technical Analysis
Function: Bullish Trend
Mode: Impulsive
Structure: Orange wave 3
Position: Navy Blue Wave 3
Next Lower Degree Direction: Orange wave 4
Details: Orange Wave 2 is likely complete, with Orange Wave 3 now progressing.
Wave Cancel Invalidation Level: 1.10092
The EURUSD daily chart, analyzed through Elliott Wave principles, highlights a robust bullish trend. The chart is currently in an impulsive mode, with orange wave 3 developing within the broader structure of navy blue wave 3. This setup indicates strong upward momentum as the market advances through this phase.
Orange wave 2 appears to have concluded, signaling the end of a corrective phase. Consequently, orange wave 3 has started, pointing towards a continuation of the upward trend. This wave is anticipated to drive the market higher as it progresses.
As orange wave 3 evolves, the next expected move is the formation of orange wave 4, typically a corrective phase following the impulsive wave 3. This could result in a retracement or consolidation before the market resumes its upward trend. However, the current focus is on the development of orange wave 3, suggesting that the bullish trend is likely to persist.
The wave cancel invalidation level is set at 1.10092. If the price falls below this level, the current wave count would be invalidated, indicating a potential shift in market direction. As long as the price remains above this critical level, the bullish outlook is expected to continue.
Summary: The EURUSD daily chart reveals a strong bullish trend, with orange wave 3 currently underway following the completion of orange wave 2. The market is anticipated to maintain its upward trajectory as Orange Wave 3 unfolds, with a potential corrective phase in Orange Wave 4 upcoming. The bullish trend remains intact as long as the price stays above the wave cancel invalidation level of 1.10092.
EURUSD Elliott Wave Analysis - Trading Lounge Day Chart
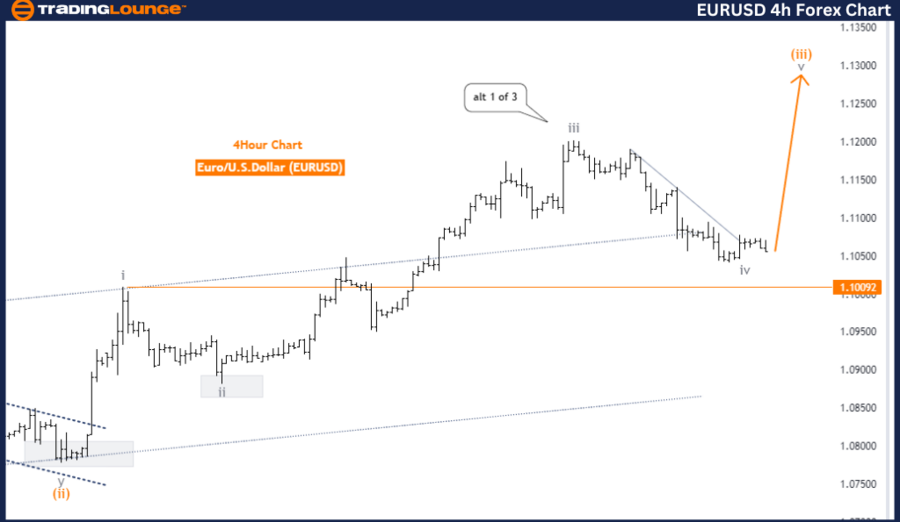
Euro/U.S. Dollar (EURUSD) 4-Hour Chart Analysis
EURUSD Currency Pair Technical Analysis
Function: Bullish Trend
Mode: Impulsive
Structure: Gray wave 5
Position: Orange wave 3
Next Lower Degree Direction: Orange wave 4
Details: Gray wave 4 seems complete, with gray wave 5 now advancing.
Wave Cancel Invalidation Level: 1.10092
The EURUSD 4-hour chart, analyzed through Elliott Wave principles, reflects a strong bullish trend. The market is in an impulsive mode, with the focus on gray wave 5 following the completion of gray wave 4. With gray wave 4 concluded, the market has transitioned into gray wave 5, indicating a continuation of the upward trend.
Gray wave 5 is actively unfolding, supported by the preceding orange wave 3. This phase suggests strong upward movement within the overall bullish structure. The market is expected to maintain this momentum as long as the price stays above the wave cancel invalidation level of 1.10092. A drop below this level would invalidate the current wave count, potentially signaling a shift in market direction.
As gray wave 5 progresses, the next step in the Elliott Wave sequence is the formation of orange wave 4, typically a corrective phase after orange wave 3. However, the primary focus is on the current development of gray wave 5, which is expected to continue pushing the market higher.
Summary: The EURUSD 4-hour chart indicates a strong bullish trend, with gray wave 5 currently advancing after the completion of gray wave 4. The market is expected to continue its upward movement unless the price falls below the critical wave cancel invalidation level of 1.10092, suggesting a healthy uptrend with further potential gains as gray wave 5 unfolds.
Technical Analyst: Malik Awais
Source: visit Tradinglounge.com and learn From the Experts Join TradingLounge Here
Previous: New Zealand Dollar/U.S. Dollar Elliott Wave Technical Analysis
Special Trial Offer - 0.76 Cents a Day for 3 Months! Click here
Access 7 Analysts Over 200 Markets Covered. Chat Room With Support