NZD/USD Elliott Wave Analysis - Trading Lounge Day Chart
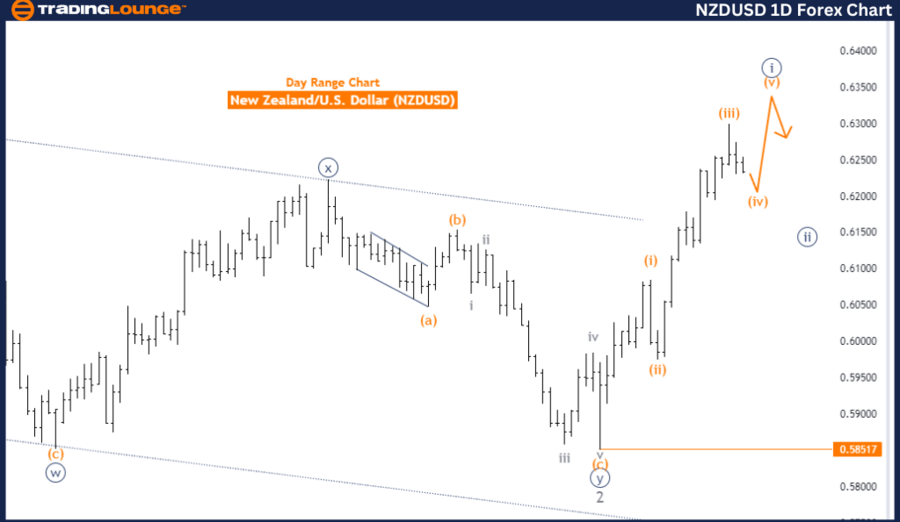
New Zealand Dollar/U.S. Dollar (NZD/USD) Day Chart Analysis
NZD/USD Elliott Wave Technical Analysis
- Function: Counter Trend
- Mode: Corrective
- Structure: Orange Wave 4
- Position: Navy Blue Wave 1
- Direction Next Higher Degrees: Orange Wave 5
- Details: Orange Wave 3 has likely completed, with Orange Wave 4 of 1 now unfolding.
- Wave Cancel Invalidation Level: 0.58517
The NZD/USD daily chart illustrates a counter-trend situation based on Elliott Wave analysis, indicating the market is currently undergoing a corrective phase. The primary structure under focus is Orange Wave 4, following the completion of Orange Wave 3. This suggests that the current market activity is corrective in nature rather than a continuation of the previous trend.
The market is positioned within Navy Blue Wave 1, marking the onset of a new wave cycle. However, due to the corrective nature of Orange Wave 4, the market is experiencing a pullback. The analysis indicates that Orange Wave 4 is still in progress following the completion of Orange Wave 3, which previously drove the market higher.
The next higher degree direction points towards the formation of Orange Wave 5. This indicates that after the current corrective phase (Orange Wave 4) completes, the market is expected to resume its upward movement, transitioning into Orange Wave 5 as part of the broader trend.
Summary: The NZD/USD daily chart is currently in a corrective phase, with Orange Wave 4 in progress following the completion of Orange Wave 3. Positioned within Navy Blue Wave 1, the market indicates the beginning of a new wave sequence. The analysis expects the market to resume its upward trend into Orange Wave 5 once the current correction concludes. This outlook remains valid as long as the price does not drop below the wave cancel invalidation level of 0.58517.
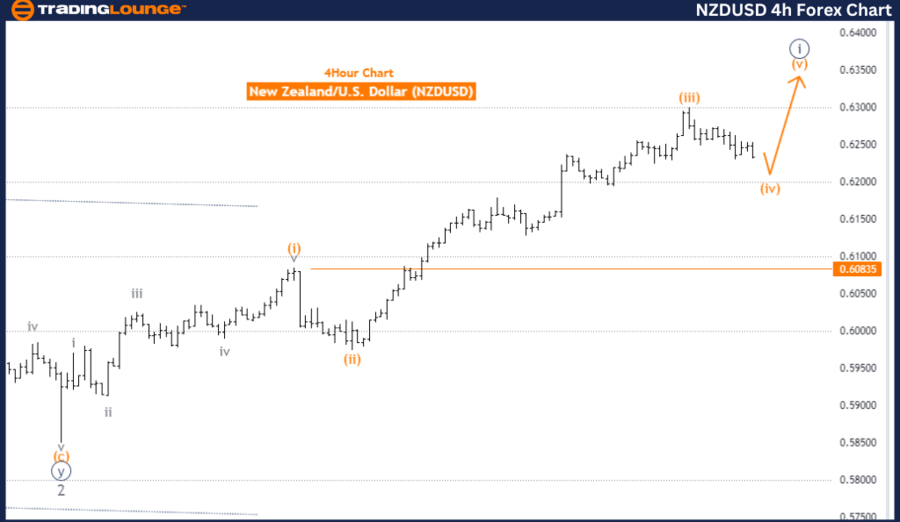
New Zealand Dollar/U.S. Dollar (NZD/USD) 4-Hour Chart
NZD/USD Currency Pair Technical Analysis
-
Function: Counter Trend
-
Mode: Corrective
-
Structure: Orange Wave 4
-
Position: Navy Blue Wave 1
-
Direction Next Higher Degrees: Orange Wave 5
-
Details: Orange Wave 3 appears completed, with Orange Wave 4 of 1 currently unfolding.
- Wave Cancel Invalidation Level: 0.60835
The NZD/USD four-hour chart reveals a counter-trend scenario according to Elliott Wave analysis, showing the market is presently in a corrective phase. The primary focus is on Orange Wave 4, part of this corrective sequence. The currency pair is within Navy Blue Wave 1, indicating the early stages of a new wave cycle.
Following the completion of Orange Wave 3, Orange Wave 4 is now in progress, suggesting the market is undergoing a retracement within the broader trend context, correcting the movements observed in the previous wave.
Looking forward, the next higher degree direction points towards the formation of Orange Wave 5, expected to start once Orange Wave 4 concludes. This suggests the market may resume its upward trajectory, continuing the established wave sequence with the initiation of Orange Wave 5.
Summary: The NZD/USD four-hour chart is currently experiencing a corrective movement via Orange Wave 4 after completing Orange Wave 3. Positioned within Navy Blue Wave 1, this setup indicates the start of a new trend sequence. The analysis projects that once Orange Wave 4 concludes, the market is likely to advance into Orange Wave 5, continuing the overall Elliott Wave pattern. This outlook remains valid as long as the price stays above the wave cancel invalidation level of 0.60835.
Technical Analyst: Malik Awais
Source: visit Tradinglounge.com and learn From the Experts Join TradingLounge Here
Previous: USDCAD Elliott Wave Technical Analysis
Special Trial Offer - 0.76 Cents a Day for 3 Months! Click here
Access 7 Analysts Over 200 Markets Covered. Chat Room With Support