13Jun

CSX Corp. (CSX) U.S. Stocks Elliott Wave Technical Daily & 1‑Hour Analysis: Wave 3 Bullish, $33 Top, $30 Retracement Setup

CSX Corp. (CSX) – Summary Elliott Wave Outlook

This updated Elliott Wave analysis of CSX Corp. examines price structure on the daily and 1-hour timeframes:

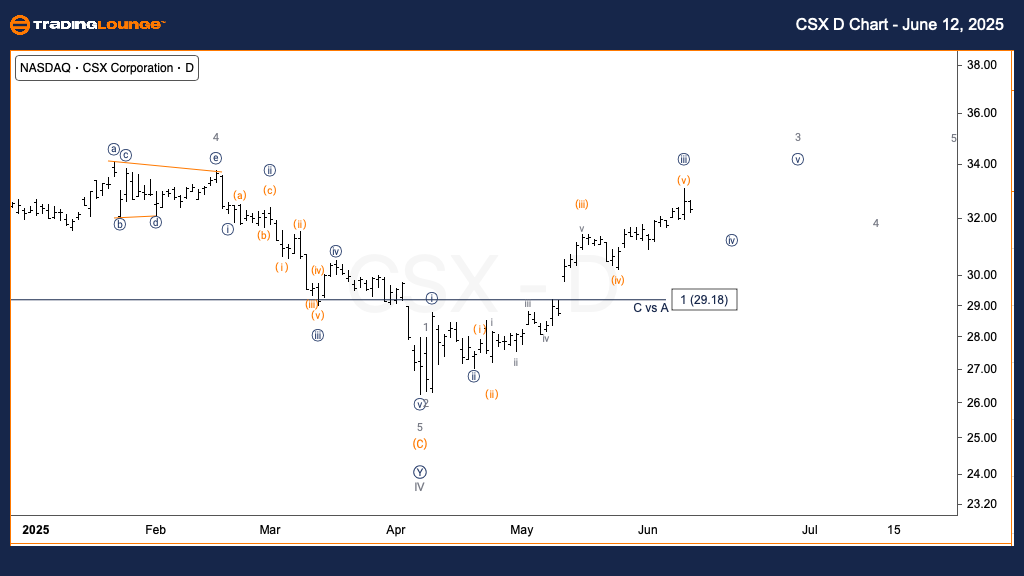
CSX Elliott Wave Analysis – Trading Lounge Daily Chart

CSX Corp. (CSX) – Daily Chart Outlook

CSX Elliott Wave Technical Review

FUNCTION: Trend

MODE: Impulsive

STRUCTURE: Motive

POSITION: Wave 3 of (1)

DIRECTION: Bullish Continuation in Wave 3

DETAILS: The stock is forming an impulsive wave pattern from its April bottom, reinforcing the bullish outlook for Minor Wave 3. Wave {iii} may be nearing completion, with an upcoming correction in wave {iv} likely to reach the $30 support zone.

CSX Daily Chart Outlook

CSX stock is trending higher within Minor Wave 3 of Primary Wave (1), beginning from the April low. The ongoing Elliott Wave structure is clearly impulsive. A short-term top in wave {iii} appears imminent, followed by a retracement in wave {iv}. This correction is expected to test the $30 area, creating a possible long entry aligned with the dominant uptrend.

CSX-us-stock-Day-cha...


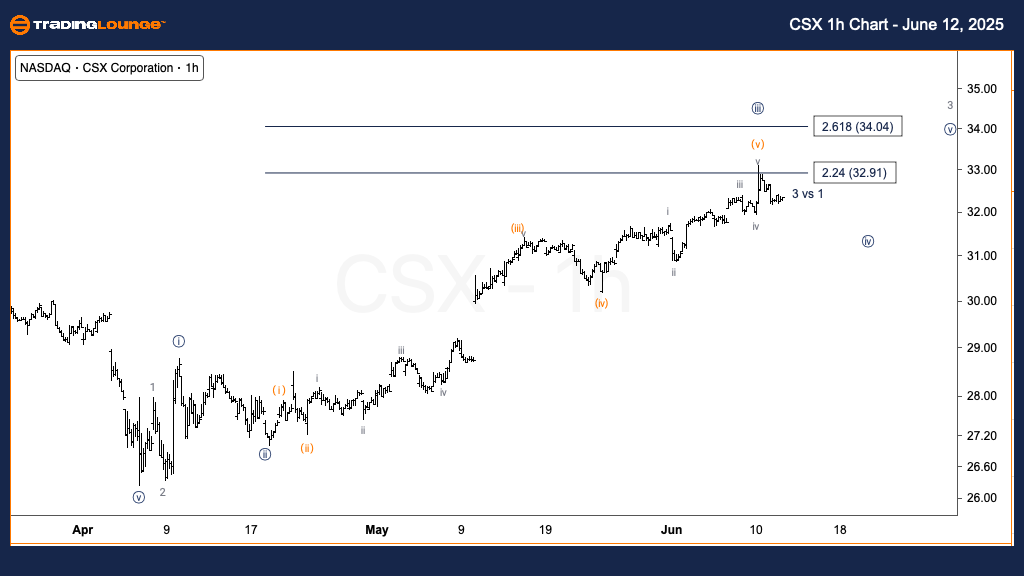
CSX Corp. (CSX) Elliott Wave Outlook – Tradinglounge 1H Chart

CSX Elliott Wave Technical Review

FUNCTION: Trend

MODE: Impulsive

STRUCTURE: Motive

POSITION: Wave (v) of {iii}

DIRECTION: Near-Term Top in Wave (v)

DETAILS: Price has reached $33, the top of Minor Group 1 (MG1), suggesting wave (v) of {iii} may be finalized. A downward correction in wave {iv} is now probable, with the $30 level acting as the next support target.

CSX Corp 1-Hour Chart Outlook

In the short-term view, CSX completed a full five-wave advance, peaking at $33 in line with MG1 resistance. This confirms a potential top in wave (v) of {iii}. Attention now shifts to a corrective movement in wave {iv}, with support anticipated around the $30 area, matching typical Fibonacci retracement zones.

Technical Analyst: Alessio Barretta

Source: Visit Tradinglounge.com and learn from the Experts. Join TradingLounge Here 

Previous: Palo Alto Networks Inc. (PANW) Elliott Wave Technical Analysis

VALUE Offer - $1 for 2 Weeks then $29 a month!Click here

Access 7 Analysts Over 200 Markets Covered. Chat Room With Support

CSX-us-stock-1h-char...

Related

XRP Ripple Elliott Wave Analysis:  Market Trends, Support & Resistance Levels, and Technical Forecast for XRPUSD

XRP Ripple Elliott Wave Analysis: Market Trends, Support & Resistance Levels, and Technical Forecast for XRPUSD

XRP Elliott Wave analysis, highlighting the current XRPUSD price movement, key support and resistanc...

Read More >
Spotify Technology S.A. (SPOT) Elliott Wave Technical Analysis: Chart Trends, Identifies Key Support levels, and Provides Insights

Spotify Technology S.A. (SPOT) Elliott Wave Technical Analysis: Chart Trends, Identifies Key Support levels, and Provides Insights

Get the latest Spotify (SPOT) stock analysis using Elliott Wave Theory. Our detailed report covers d...

Read More >
Theta Token (THETAUSD) Wave 4 Consolidation Near Fibonacci Support Points to Wave 5 Breakout Opportunity in Bullish Elliott Wave Setup

Theta Token (THETAUSD) Wave 4 Consolidation Near Fibonacci Support Points to Wave 5 Breakout Opportunity in Bullish Elliott Wave Setup

Theta Token (THETAUSD) is consolidating in wave 4 within a bullish Elliott Wave structure. A breakou...

Read More >
Neo/ U.S. dollar(NEOUSD) Elliott Wave Technical Analysis: Riding the Uptrend Wave

Neo/ U.S. dollar(NEOUSD) Elliott Wave Technical Analysis: Riding the Uptrend Wave

Explore our latest NEO/USD Elliott Wave Analysis for March 6, 2024, to uncover valuable insights int...

Read More >
COAL INDIA Elliott Wave Chart Analysis: Daily and Weekly Forecasts Revealing Wave C’s Role in Impulsive Correction Phase

COAL INDIA Elliott Wave Chart Analysis: Daily and Weekly Forecasts Revealing Wave C’s Role in Impulsive Correction Phase

Elliott Wave breakdown of COAL INDIA, focusing on Gray Wave C within the corrective Orange Wave 4 ac...

Read More >
Costco Wholesale Corp. (COST) Elliott Wave Technical Analysis: Stay Updated on Stock Trends and Make Informed Trading Decisions

Costco Wholesale Corp. (COST) Elliott Wave Technical Analysis: Stay Updated on Stock Trends and Make Informed Trading Decisions

This analysis provides a detailed Elliott Wave review of Costco Wholesale Corp. (COST), covering the...

Read More >

$1 for 2 Weeks

then $29 a month!

What a Special Offer!

Trade Recommendations

Unleash the power of deversified trading with our comprehensive portfolio, covering 250+ markets:

  • Stock Trades
  • Crypto Trades
  • Forex Trades
  • Commodity Trades
Elliott Wave Analysis

Gain a competitive edge with expert insights and AI-powered Elliott Wave charting into:

  • Global Indices
  • US Stocks & ASX Stocks
  • Forex & Crypto
  • Commodities
Top-Notch Trading Tools

Equip yourself with the tools of success:

  • Real-time Chat rooms
  • Elliott Wave Algorithm
  • Portfolio tools
  • TradingLevels
  • Screener
  • Trading Game
7 Elliott Wave Analysts

Stay ahead of the market with daily charts and insightful videos
Your secret to strategic trading!

JOIN HERE


Welcome to TradingLounge (ASIC A.R.No. 321187), specialists in trades, trading education and technical analysis, covering stocks, indices, commodities, forex and cryptocurrencies.

When you join TradingLounge you have access to everything we offer, including trade tools, educational content and a social platform to chat with like-minded investors.

Read more

@Copyright 2024 by tradinglounge.com

Contact Us

Australian no: 02 4787 6020

International no: +61 (2) 47876020

Pay with:

Find us on