Natural Gas Elliott Wave Technical Analysis

Natural Gas is rapidly recovering from its late August low. The commodity is approaching key highs seen in June and January 2024, as well as the late October 2023 high, and is likely to surpass or match these levels in the upcoming weeks. However, this bullish trend that started in October 2023 is part of a larger bullish correction from the February 2024 low. As long as the bullish correction continues, short-term traders may find buying opportunities during pullbacks until the price reaches the resistance zone of 2.65-3.37.

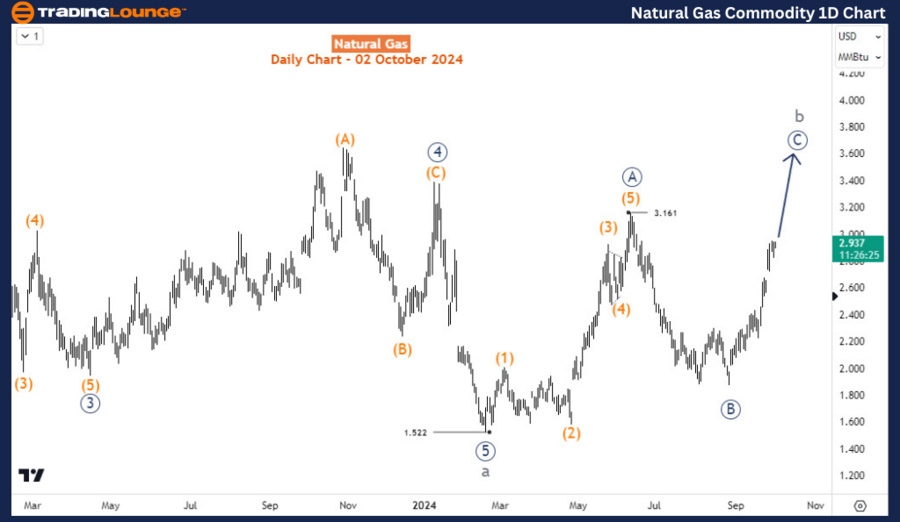
Natural Gas Commodity Elliott Wave - Daily Chart Analysis

On the daily chart, the current price action is a correction of the bearish impulse wave that started from the high of August 2022 when Natural Gas was trading near $10. This impulse structure is labeled as wave a of the cycle degree. From the low at 1.522, where wave a completed, the corrective wave b began. Wave b of the cycle degree is anticipated to form a corrective pattern. Price has already finished primary degree waves A and B (circled) of c in June and August 2024, respectively. From the August low, primary degree wave C (circled) of b has developed into an impulsive structure. According to projections, wave C (circled) could extend up to 3.53 and possibly reach as high as 4.17. This offers potential for short-term traders to continue buying pullbacks on the hourly charts.

Natural-Gas-Commodit...


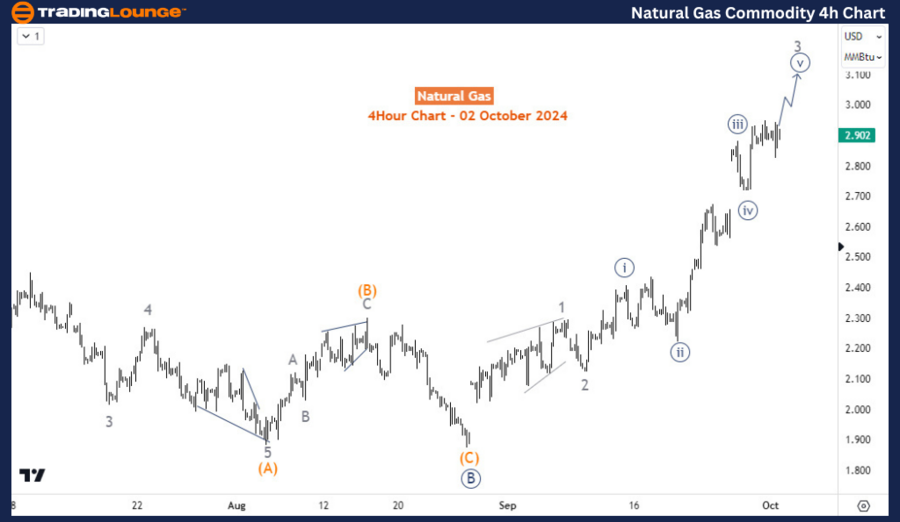
Natural Gas Commodity Elliott Wave - 4-Hour Chart Analysis

The H4 chart outlines the sub-waves of wave C (circled) and illustrates the progress made so far. Currently, the price is in wave 5 of (3) of C (circled). The next anticipated pullback, wave (4), if corrective, may present another buying opportunity from the dip.

Technical Analyst: Sanmi Adeagbo

Source: visit Tradinglounge.com and learn From the Experts Join TradingLounge Here 

See Previous: Iron Ore Elliott Wave Technical Analysis

VALUE Offer - Buy 1 Month & Get 3 Months!Click here

Access 7 Analysts Over 200 Markets Covered. Chat Room With Support

Natural-Gas-Commodit...

Related

Bitcoin/U.S. dollar(BTCUSD) Elliott Wave Technical Analysis 13 October 23

Bitcoin/U.S. dollar(BTCUSD) Elliott Wave Technical Analysis 13 October 23

Elliott Wave Technical Analysis of Bitcoin/U.S. dollar(BTCUSD) 13 October 23

Read More >
NEO Crypto Price News Today Elliott Wave Technical Analysis of NEO/USD: TradingLounge Daily and H4 Chart Overview

NEO Crypto Price News Today Elliott Wave Technical Analysis of NEO/USD: TradingLounge Daily and H4 Chart Overview

This article provides a detailed Elliott Wave analysis of the NEO/USD currency pair, highlighting ke...

Read More >
Utilizing Elliott Wave theory On TASI Index Stock Market Analysis: TASI Index Elliott Wave Technical Analysis

Utilizing Elliott Wave theory On TASI Index Stock Market Analysis: TASI Index Elliott Wave Technical Analysis

Our detailed TASI Index Elliott Wave analysis provides insights into market trends, wave structure, ...

Read More >
Elliott Wave Analysis Indices: SP 500 & NASDAQ

Elliott Wave Analysis Indices: SP 500 & NASDAQ

Elliott Wave Analysis Summary: Indices SP 500 & NASDAQ - Current wave: v of (v) of iii) of 1 o...

Read More >
Corn Commodity Elliott Wave Technical Analysis: Stay Informed and Make Strategic Decisions in the Commodity Trading Landscape

Corn Commodity Elliott Wave Technical Analysis: Stay Informed and Make Strategic Decisions in the Commodity Trading Landscape

Explore the latest Elliott Wave Analysis for Corn, highlighting bearish trends and potential market ...

Read More >
ASX: Northern Star Resources (NST) Elliott Wave Technical Analysis, Stock Forecast, Support & Resistance Levels for Traders

ASX: Northern Star Resources (NST) Elliott Wave Technical Analysis, Stock Forecast, Support & Resistance Levels for Traders

This Elliott Wave technical analysis of ASX: Northern Star Resources Ltd (NST) provides insights int...

Read More >

$1 for 2 Weeks

then $29 a month!

What a Special Offer!

Trade Recommendations

Unleash the power of deversified trading with our comprehensive portfolio, covering 250+ markets:

  • Stock Trades
  • Crypto Trades
  • Forex Trades
  • Commodity Trades
Elliott Wave Analysis

Gain a competitive edge with expert insights and AI-powered Elliott Wave charting into:

  • Global Indices
  • US Stocks & ASX Stocks
  • Forex & Crypto
  • Commodities
Top-Notch Trading Tools

Equip yourself with the tools of success:

  • Real-time Chat rooms
  • Elliott Wave Algorithm
  • Portfolio tools
  • TradingLevels
  • Screener
  • Trading Game
7 Elliott Wave Analysts

Stay ahead of the market with daily charts and insightful videos
Your secret to strategic trading!

JOIN HERE


Welcome to TradingLounge (ASIC A.R.No. 321187), specialists in trades, trading education and technical analysis, covering stocks, indices, commodities, forex and cryptocurrencies.

When you join TradingLounge you have access to everything we offer, including trade tools, educational content and a social platform to chat with like-minded investors.

Read more

@Copyright 2024 by tradinglounge.com

Contact Us

Australian no: 02 4787 6020

International no: +61 (2) 47876020

Pay with:

Find us on