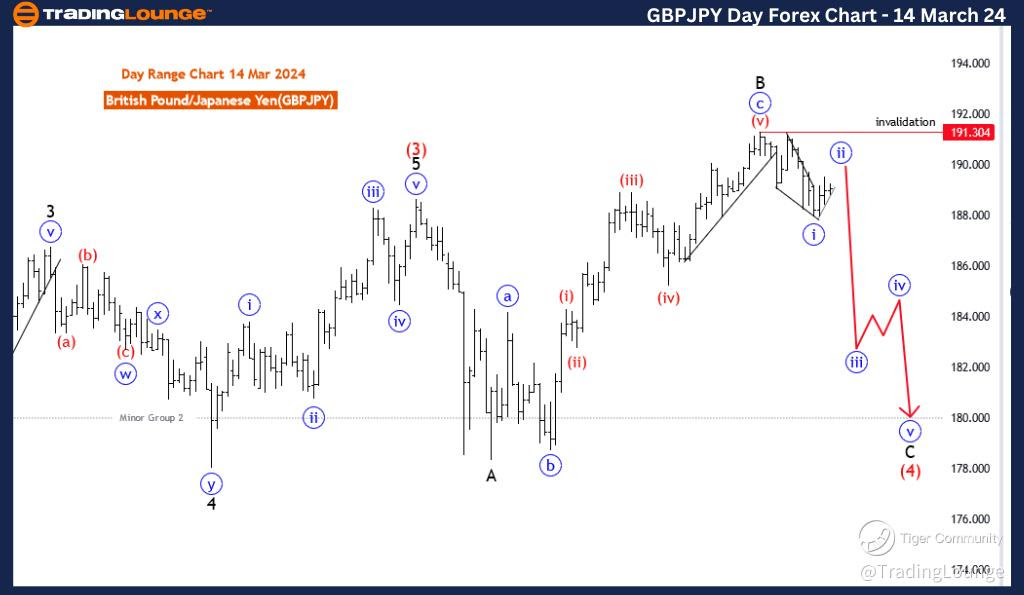
GBPJPY Elliott Wave Analysis Trading Lounge Day Chart,
British Pound/Japanese Yen(GBPJPY) Day Chart Analysis
GBPJPY Elliott Wave Technical Analysis
FUNCTION: Counter Trend
MODE: impulsive as C
STRUCTURE: blue wave 2
POSITION: black wave C
DIRECTION NEXT LOWER DEGREES: blue wave 3
DETAILS: Blue wave 2 of C is in play and looking near to end After that wave 3 will start. Wave Cancel invalid level: 191.304
The GBP/JPY Elliott Wave Analysis for the day chart on 14 March 24, provides insights into potential price movements in the British Pound/Japanese Yen currency pair, employing Elliott Wave principles within the framework of technical analysis.
Identified as a "Counter Trend" scenario, the analysis suggests a focus on identifying and interpreting price movements that run counter to the prevailing trend. This indicates an emphasis on capturing potential reversals or corrective phases within the broader trend direction.
The specified "MODE" is characterized as "impulsive as C," which implies that the current corrective phase (labelled as C) is exhibiting impulsive characteristics. Impulsive waves typically represent strong directional movements within Elliott Wave theory.
The "STRUCTURE" is denoted as "blue wave 2," indicating the current corrective wave within the Elliott Wave count. This suggests that the market is undergoing a corrective phase following a preceding impulsive movement.
The "POSITION" is described as "black wave C," signifying the placement of the current corrective wave within the larger Elliott Wave structure. Black wave C represents a higher-degree wave within the ongoing Elliott Wave count, indicating its significance in the overall price action.
"DIRECTION NEXT LOWER DEGREES" is identified as "blue wave 3," suggesting the anticipated direction for the subsequent lower-degree wave. This implies an expectation of a continuation of the corrective phase following the completion of the current wave.
In the "DETAILS" section, it is mentioned that "blue wave 2 of C is in play and looking near to end. After that wave 3 will start." This indicates that the current corrective phase (blue wave 2 of C) is nearing completion, with an anticipation of a subsequent wave 3 to commence.
The "Wave Cancel invalid level" is set at 191.304, serving as a critical threshold. A breach beyond this level would invalidate the current wave count, necessitating a reassessment of the analysis.
In summary, the GBP/JPY Elliott Wave Analysis for the day chart on 14 March 24, suggests a counter-trend scenario characterized by an impulsive corrective phase labeled as blue wave 2 within the broader context of black wave C. The analysis anticipates the completion of the current corrective wave, followed by the initiation of a new phase represented by wave 3. The Wave Cancel invalid level at 191.304 provides a reference point for monitoring potential shifts in the wave count and trend dynamics.
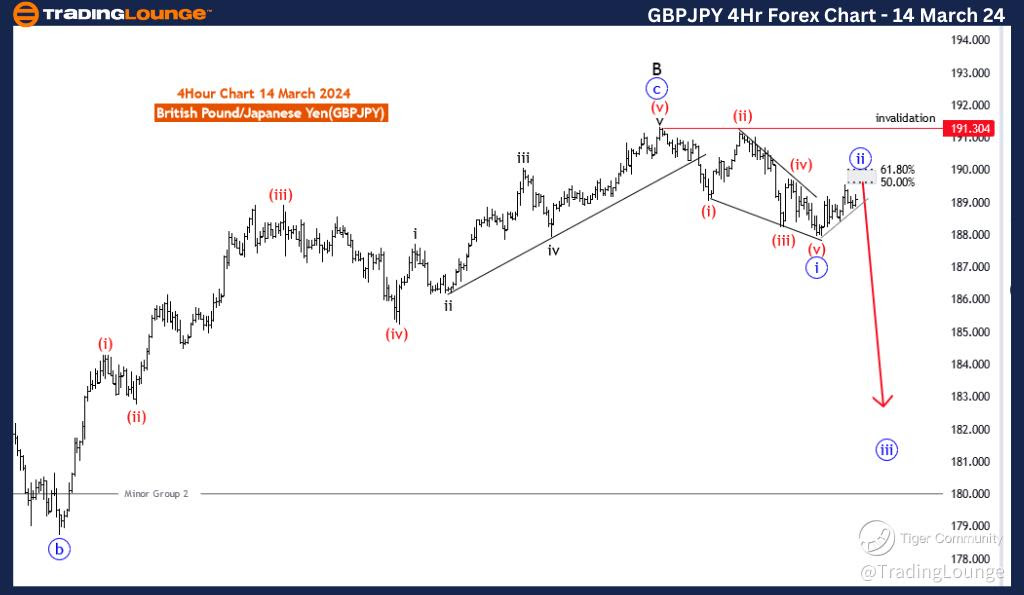
GBPJPY Elliott Wave Analysis Trading Lounge 4 Hour Chart, 14 March 24
British Pound/Japanese Yen(GBPJPY) 4 Hour Chart
GBPJPY Elliott Wave Technical Analysis
FUNCTION: Trend
MODE: Corrective
STRUCTURE: blue wave 2
POSITION: black wave C
DIRECTION NEXT LOWER DEGREES: blue wave 3
DETAILS: blue wave 2 of C is in play and looking near to end After that wave 3 will start. Wave Cancel invalid level: 191.304
The GBP/JPY Elliott Wave Analysis for the 4-hour chart on 14 March 24, provides insights into potential price movements in the British Pound/Japanese Yen currency pair, utilizing Elliott Wave principles within the framework of technical analysis.
The identified "FUNCTION" is "Trend," indicating a focus on identifying and interpreting directional movements within the prevailing trend. This suggests an emphasis on capturing and understanding sustained price trends.
The specified "MODE" is characterized as "Corrective," suggesting that the market is currently in a phase of price correction within the broader trend. Corrective phases typically represent temporary counter-trend movements.
The "STRUCTURE" is denoted as "blue wave 2," highlighting the current corrective wave within the Elliott Wave count. In Elliott Wave theory, corrective waves serve to counteract the primary trend and often occur in three-wave patterns.
The "POSITION" is described as "black wave C," indicating the placement of the current corrective wave within the larger Elliott Wave structure. Black wave C signifies a higher-degree wave within the ongoing Elliott Wave count.
"DIRECTION NEXT LOWER DEGREES" is identified as "blue wave 3," suggesting the anticipated direction for the subsequent lower-degree wave. This implies an expectation of a continuation of the corrective phase following the completion of the current wave.
In the "DETAILS" section, it is mentioned that "blue wave 2 of C is in play and looking near to the end. After that wave 3 will start." This signifies that the current corrective phase (blue wave 2 of C) is nearing completion, with an anticipation of a subsequent wave 3 to commence.
The "Wave Cancel invalid level" is set at 191.304, serving as a critical threshold. A breach beyond this level would invalidate the current wave count, necessitating a reassessment of the analysis.
In summary, the GBP/JPY Elliott Wave Analysis for the 4-hour chart on 14 March 24, suggests a corrective phase labeled as blue wave 2 within the broader context of black wave C. The analysis anticipates the completion of the current corrective wave, followed by the initiation of a new phase represented by wave 3. The Wave Cancel invalid level at 191.304 provides a reference point for monitoring potential shifts in the wave count and trend dynamics.
Technical Analyst: Malik Awais
Source: visit Tradinglounge.com and learn From the Experts Join TradingLounge Here
See Previous: British Pound/U.S.Dollar (GBPUSD)
TradingLounge Once Off SPECIAL DEAL: Here > 1 month Get 3 months.