Wheat Commodity Elliott Wave Technical Analysis

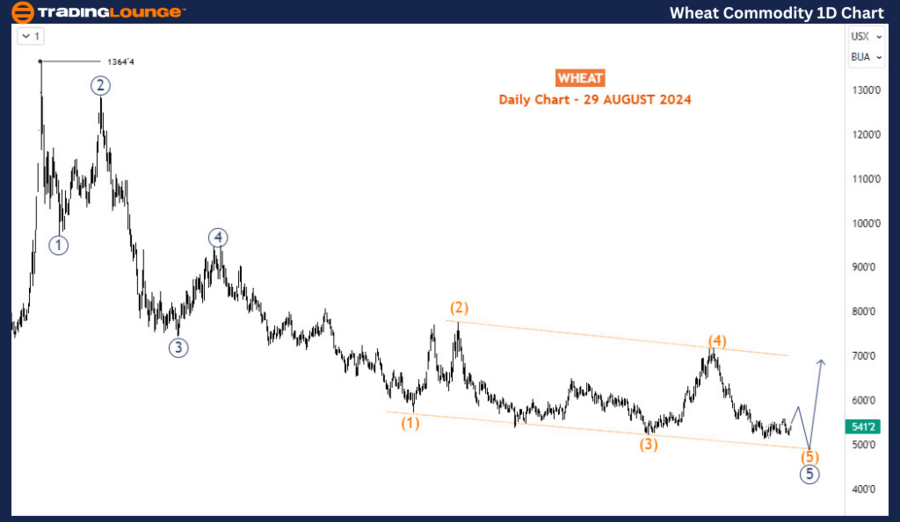
Since its peak in March 2022, wheat prices have undergone a significant decline, dropping nearly 61% from over 1360 to approximately 540. This notable decrease reflects a prolonged bearish cycle that has lasted for over 28 months. However, according to Elliott Wave analysis, this bearish phase appears to be nearing its end, indicating a potential start of a multi-month bullish phase. This expected upward movement could serve as a corrective phase, counteracting the extended period of selling pressure.

Wheat Elliott Wave Technical Analysis

Wheat Commodity Daily Chart Analysis

The daily chart reveals that the downtrend from the March 2022 high of 1364 has followed a well-defined impulse wave structure. This structure is now in its final stage, with the fifth wave approaching completion. The fifth wave, which began in May 2024, is currently forming what appears to be an ending diagonal pattern—a common pattern in the final stages of an impulse wave. The development of this diagonal suggests that the decline is losing momentum, and a reversal could be imminent. However, it's essential to consider that Wave (5) might still evolve into a three-swing structure before fully completing. This implies that while wheat prices could dip further, potentially reaching the 500 level or slightly below, the ongoing rebound could see prices rise to the 560-590 range before the sell-off resumes. This price action would align with the typical behavior of an ending diagonal, where a final push lower is often followed by a significant corrective rally.
Wheat-Commodity-1D-C...


Wheat Commodity H4 Chart Analysis

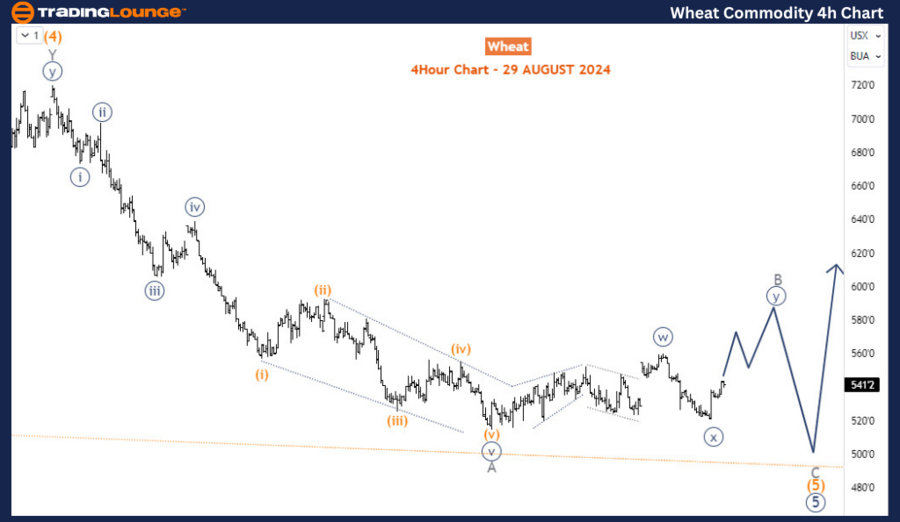
The H4 chart provides a closer look at the sub-waves within Wave (5) of the diagonal structure observed in Wave 5 (circled) on the daily chart. This wave is expected to complete a corrective three-wave structure. The initial sub-wave, Wave A, appears to have completed a bearish impulse move from the peak in May 2024. Following this, the current bounce from the July 2024 low is identified as Wave B, which seems to be forming a corrective pattern. Early indications suggest that Wave B is developing into a double zigzag pattern, a complex correction often seen in Elliott Wave analysis. As long as the low from August 27th remains intact, Wave B could extend higher, potentially offering a short-term rally before the broader downtrend continues. This scenario highlights the importance of monitoring key support levels, as a breach of the August 27th low could invalidate the current corrective pattern and suggest further downside risk.

Technical Analyst: Sanmi Adeagbo

Source: visit Tradinglounge.com and learn From the Experts Join TradingLounge Here 

See Previous: Copper Elliott Wave Technical Analysis 

Special Trial Offer - 0.76 Cents a Day for 3 Months! Click here

Access 7 Analysts Over 200 Markets Covered. Chat Room With Support
Wheat-Commodity-4h-C...


Summary

While the long-term downtrend in wheat may still have room to continue, the market is showing signs of nearing a significant bottom, with the potential for a multi-month bullish correction on the horizon.

Related

U.S. Dollar / Japanese Yen (USDJPY) Forex Elliott Wave Technical Analysis Reveals Key Correction and Wave Breakout Setup

U.S. Dollar / Japanese Yen (USDJPY) Forex Elliott Wave Technical Analysis Reveals Key Correction and Wave Breakout Setup

USDJPY shows a corrective wave 2 unfolding in a broader bullish trend. Watch for reversal signals an...

Read More >
The Home Depot (HD) Elliott Wave Analysis: Stock Forecast, Technical Insights and Market Trends for Smart Trading Strategies

The Home Depot (HD) Elliott Wave Analysis: Stock Forecast, Technical Insights and Market Trends for Smart Trading Strategies

The Home Depot (HD) Elliott Wave analysis, providing a detailed stock forecast and technical breakdo...

Read More >
Unlocking ASX Trading Success: ASX LIMITED – ASX Stock Analysis & Elliott Wave Technical Forecast

Unlocking ASX Trading Success: ASX LIMITED – ASX Stock Analysis & Elliott Wave Technical Forecast

Our latest Elliott Wave analysis on ASX Limited provides valuable insights into stock market trends ...

Read More >
 Bovespa Index Elliott Wave Technical Analysis Highlights Impulsive Trend and Trading Strategy in Brazil’s Stock Market Analysis

Bovespa Index Elliott Wave Technical Analysis Highlights Impulsive Trend and Trading Strategy in Brazil’s Stock Market Analysis

Elliott Wave count for the Bovespa Index, highlighting impulsive wave development and potential trad...

Read More >
NIFTY 50 Elliott Wave Technical Analysis for 2025: Corrective Waves, Trend Reversals, Expanded Flat Patterns, and Key Price Levels

NIFTY 50 Elliott Wave Technical Analysis for 2025: Corrective Waves, Trend Reversals, Expanded Flat Patterns, and Key Price Levels

NIFTY 50 index uses Elliott Wave principles to forecast key market movements, including corrective w...

Read More >
Learn about critical price levels and ASX market trends to enhance your trading confidence: ASX  LIMITED Elliott Wave Technical Forecast

Learn about critical price levels and ASX market trends to enhance your trading confidence: ASX LIMITED Elliott Wave Technical Forecast

Dive into a comprehensive Elliott Wave analysis of ASX Limited. Discover key insights, stock forecas...

Read More >

$1 for 2 Weeks

then $29 a month!

What a Special Offer!

Trade Recommendations

Unleash the power of deversified trading with our comprehensive portfolio, covering 250+ markets:

  • Stock Trades
  • Crypto Trades
  • Forex Trades
  • Commodity Trades
Elliott Wave Analysis

Gain a competitive edge with expert insights and AI-powered Elliott Wave charting into:

  • Global Indices
  • US Stocks & ASX Stocks
  • Forex & Crypto
  • Commodities
Top-Notch Trading Tools

Equip yourself with the tools of success:

  • Real-time Chat rooms
  • Elliott Wave Algorithm
  • Portfolio tools
  • TradingLevels
  • Screener
  • Trading Game
7 Elliott Wave Analysts

Stay ahead of the market with daily charts and insightful videos
Your secret to strategic trading!

JOIN HERE


Welcome to TradingLounge (ASIC A.R.No. 321187), specialists in trades, trading education and technical analysis, covering stocks, indices, commodities, forex and cryptocurrencies.

When you join TradingLounge you have access to everything we offer, including trade tools, educational content and a social platform to chat with like-minded investors.

Read more

@Copyright 2024 by tradinglounge.com

Contact Us

Australian no: 02 4787 6020

International no: +61 (2) 47876020

Pay with:

Find us on