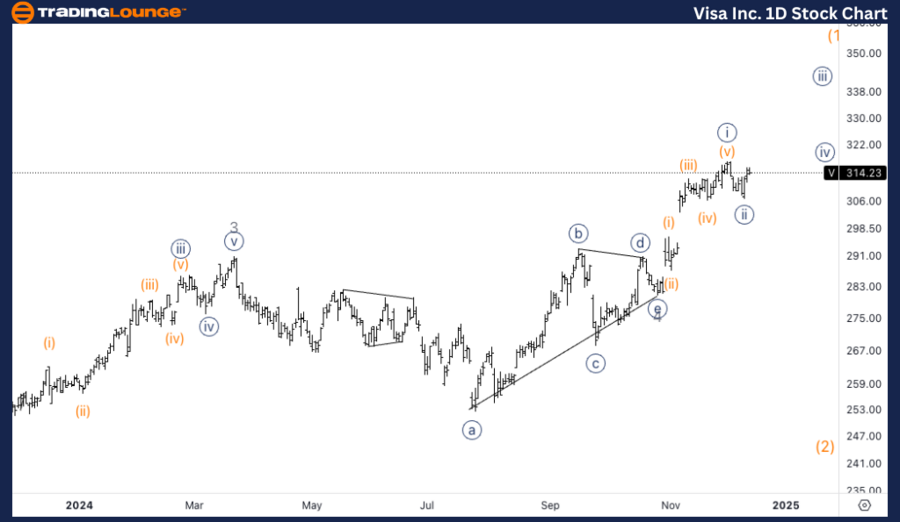
Visa Inc. (V) Elliott Wave Analysis - Trading Lounge Daily Chart
V Elliott Wave Technical Analysis
Function: Trend
Mode: Impulsive
Structure: Motive
Position: Wave 5 of (1)
Direction: Upside in wave 5
Details: Visa Inc. (V) is demonstrating a strong bullish trend as the stock trades above Trading Level 3 at $300. A potential extension in Minor wave 5 suggests further upward momentum as the stock progresses within its impulsive wave structure.
V Elliott Wave Technical Analysis – Daily Chart
Visa's daily chart analysis highlights that the stock is in wave 5 of (1), with continued upward momentum. The price trading above the critical level of $300 underlines robust bullish sentiment. The likelihood of an extension in Minor wave 5 may push prices higher, maintaining the stock's upward trajectory in alignment with Elliott Wave principles.

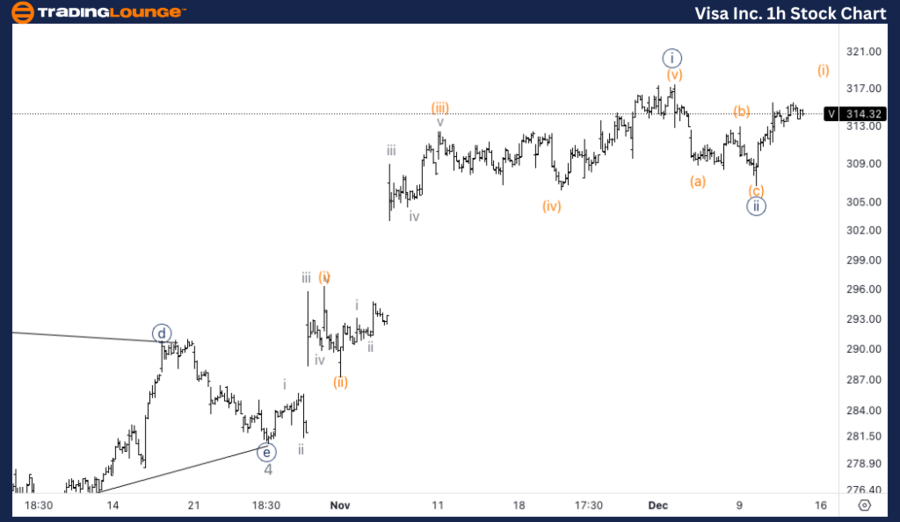
Visa Inc. (V) Elliott Wave Analysis - Trading Lounge 1H Chart
V Elliott Wave Technical Analysis
Function: Trend
Mode: Impulsive
Structure: Motive
Position: Wave {iii} of 5
Direction: Upside in wave {iii}
Details: Visa's 1-hour chart reveals a three-wave pattern forming wave {iii} of 5, which ended just above $300. The stock is expected to see further upside into wave (i) of {iii}, reinforcing its bullish trend.
V Elliott Wave Technical Analysis – 1H Chart
The 1-hour chart analysis shows Visa in wave {iii} of 5, exhibiting a clear three-wave structure within this phase. Maintaining strength above the $300 level, the stock is poised for further gains. Analysts are closely watching for a continuation into wave (i) of {iii}, supporting the ongoing uptrend and the Elliott Wave outlook.
Technical Analyst: Alessio Barretta
Source: visit Tradinglounge.com and learn From the Experts Join TradingLounge Here
See Previous: Analog Devices Inc. (ADI) Elliott Wave Technical Analysis
VALUE Offer - Buy 1 Month & Get 3 Months!Click here
Access 7 Analysts Over 200 Markets Covered. Chat Room With Support
