12Dec

Analog Devices Inc. (ADI) Elliott Wave Technical Analysis: Daily and 1-Hour Charts Highlight Trends, Corrective Structures, and Bullish Reversals Ahead

Analog Devices Inc. (ADI) Elliott Wave Analysis Trading Lounge Daily Chart

ADI Elliott Wave Technical Analysis

Function: Trend

Mode: Impulsive

Structure: Motive

Position: Wave {ii} of 1

Direction: Upside into Wave {iii}

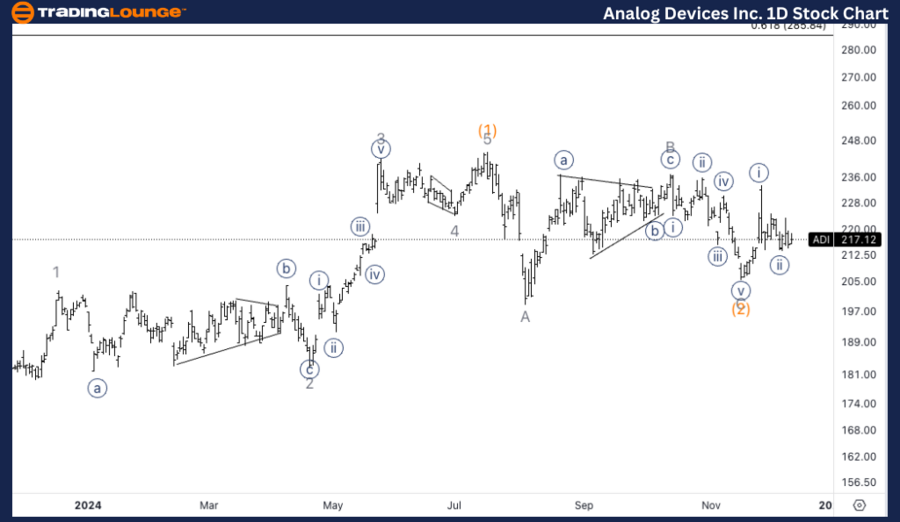
Details: The analysis focuses on identifying a potential bottom in Wave {ii}, which is anticipated to precede a significant upward movement into Wave {iii}. Currently, price action resides within the Minor Group 1 range of $210–$230, signaling that a bottom might be near.

Daily Chart Analysis Summary

The daily chart indicates that ADI is navigating Wave {ii} within a broader impulsive structure. Price movements are confined to the $210–$230 range, corresponding to Minor Group 1, suggesting the formation of a bottom. Following this correction, Wave {ii} is expected to complete, paving the way for a bullish surge into Wave {iii}.

Analog-Devices-Inc-1...


Analog Devices Inc. (ADI) Elliott Wave Analysis Trading Lounge 1H Chart

ADI Elliott Wave Technical Analysis

Function: Trend

Mode: Impulsive

Structure: Motive

Position: Wave (b) of {ii}

Direction: Bottom in Wave {ii}

Details: The 1-hour chart suggests that ADI is progressing within Wave (b) of {ii}, forming a corrective triangle. The likely next step is a downward move into Wave (c) of {ii}, signaling the end of this corrective phase. This sets the stage for a bullish reversal into Wave {iii}.

1H Chart Analysis Summary

The 1-hour chart highlights that ADI is in the middle of a corrective structure within Wave (b) of {ii}, characterized by a triangle formation. A drop into Wave (c) of {ii} is anticipated, which will likely conclude the corrective phase and trigger a strong upward movement into Wave {iii}.

Technical Analyst: Alessio Barretta

Source: visit Tradinglounge.com and learn From the Experts Join TradingLounge Here 

See Previous: The Home Depot (HD) Elliott Wave Technical Analysis 

VALUE Offer - Buy 1 Month & Get 3 Months!Click here

Access 7 Analysts Over 200 Markets Covered. Chat Room With Support

Analog-Devices-Inc-1...


Conclusion

This Elliott Wave analysis of Analog Devices Inc. (ADI) evaluates both daily and 1-hour chart structures, offering insights into current trends and future price movements. The analysis suggests that the corrective phase in Wave {ii} is nearing completion, with an impending bullish breakout into Wave {iii}.

Related

Apply Technical Indicators to Predict Bitcoin's next move: Bitcoin Crypto Price News and BTCUSD Elliott Wave Technical Analysis

Apply Technical Indicators to Predict Bitcoin's next move: Bitcoin Crypto Price News and BTCUSD Elliott Wave Technical Analysis

This article provides a comprehensive Bitcoin price analysis based on the Elliott Wave theory. It co...

Read More >
Strategic insights for traders on Bitcoin Crypto Price News Today Elliott Wave Technical Analysis

Strategic insights for traders on Bitcoin Crypto Price News Today Elliott Wave Technical Analysis

In this article, we provide a comprehensive BTCUSD Elliott Wave analysis focusing on Bitcoin's p...

Read More >
Tech Mahindra Stocks Elliott Wave Technical Analysis: Insights into Potential Stock Movements and Price Predictions

Tech Mahindra Stocks Elliott Wave Technical Analysis: Insights into Potential Stock Movements and Price Predictions

This article provides a comprehensive Elliott Wave analysis of Tech Mahindra, offering insights into...

Read More >
Our Detailed Technical Insights of ASX Brambles Limited- BXB Stock Analysis & Elliott Wave Technical Forecast

Our Detailed Technical Insights of ASX Brambles Limited- BXB Stock Analysis & Elliott Wave Technical Forecast

Explore the latest Elliott Wave analysis for BRAMBLES LIMITED (BXB) on the ASX. Our detailed technic...

Read More >
Costco Wholesale Corp.(COST:NASDAQ) Elliott Wave Technical Analysis 10 January 24

Costco Wholesale Corp.(COST:NASDAQ) Elliott Wave Technical Analysis 10 January 24

Costco Wholesale Corp.(COST: NASDAQ) Elliott Wave Technical Analysis Dated 10 January 24 with 4-Hour...

Read More >
British Pound/U.S.Dollar (GBPUSD) Elliott Wave Technical Analysis 19 October 23

British Pound/U.S.Dollar (GBPUSD) Elliott Wave Technical Analysis 19 October 23

In summary, the GBPUSD Elliott Wave Analysis for 19 October 23, delivers valuable insights into the ...

Read More >

Buy 1 Month

Get 3 Months!

Special Offer:

Trade Recommendations

Unleash the power of deversified trading with our comprehensive portfolio, covering:

  • Stock Trades
  • Crypto Trades
  • Forex Trades
  • Commodity Trades
Elliott Wave Analysis

Gain a competive edge with expert insights in to:

  • Global Indices
  • US Stocks & ASX Stocks
  • Forex & Crypto
  • Commodities
Top-Notch Trading Tools

Equip yourself with the tools of success:

  • Social Chat
  • Elliott Wave Algorithm
  • Screener
  • TradingLevels
  • Trading Game
7 Elliott Wave Analysts

Stay ahead of the market with daily charts and insightful videos
-Your secret to strategic trading!

JOIN HERE


Welcome to TradingLounge (ASIC A.R.No. 321187), specialists in trades, trading education and technical analysis, covering stocks, indices, commodities, forex and cryptocurrencies.

When you join TradingLounge you have access to everything we offer, including trade tools, educational content and a social platform to chat with like-minded investors.

Read more

@Copyright 2024 by tradinglounge.com

Contact Us

Australian no: 02 4787 6020

International no: +61 (2) 47876020

Pay with:

Find us on