05Dec

Elliott Wave Technical Analysis of Tata Motors: Share Price Trends, Forecasts, Technical Patterns, and Investment Insights for Market Success

TATA MOTORS – TATAMOTORS (1D Chart) Elliott Wave Technical Analysis

TATAMOTORS Elliott Wave Technical Analysis

Function: Counter Trend (Minute degree, Navy)

Mode: Corrective

Structure: Potential Impulse within larger degree corrective wave

Position: Minute Wave ((v)) Navy

Details: Minute Wave ((v)) Navy appears to be complete around the 770 mark, signaling the possibility of a counter-trend rally in the near term.

Invalidation Point: 1145-50

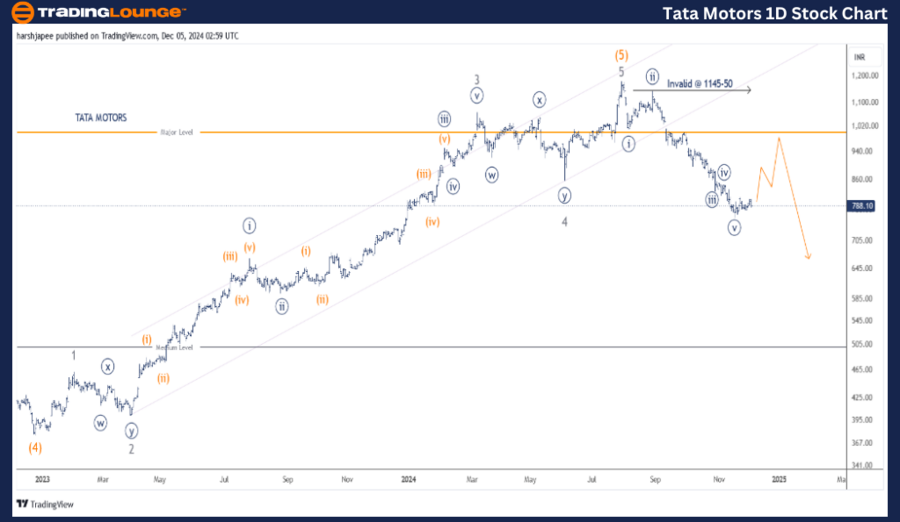
TATA MOTORS Daily Chart Technical Analysis and Potential Elliott Wave Counts

The daily chart for TATA MOTORS suggests a potential trend reversal following the high of 1145-50, recorded in July 2024. The initial impulse drop may have concluded around the 770 level or is approaching completion, with the possibility of one more low. Alternatively, Minor Wave 4 might have concluded at 770, setting the stage for an upward move.

Previously, TATA MOTORS experienced a decline from the 380 level in December 2022, marking Intermediate Wave (5) Orange. The subsequent rally can be subdivided into five distinct waves, labeled as Minor Waves 1 through 5.

If this analysis holds, the price is likely to remain below the 1145-50 range, continuing to form lower highs and lower lows, indicating bearish control.

TATA-MOTORS-1d-stock...


TATA MOTORS – TATAMOTORS (4H Chart) Elliott Wave Technical Analysis

Function: Counter Trend (Minute degree, Navy)

Mode: Corrective

Structure: Potential Impulse within larger degree corrective wave

Position: Minute Wave ((v)) Navy

Details: Minute Wave ((v)) Navy might have completed around the 770 level, paving the way for a counter-trend rally. Alternatively, the stock could reach another low below 770 before transitioning higher.

Invalidation Point: 1145-50

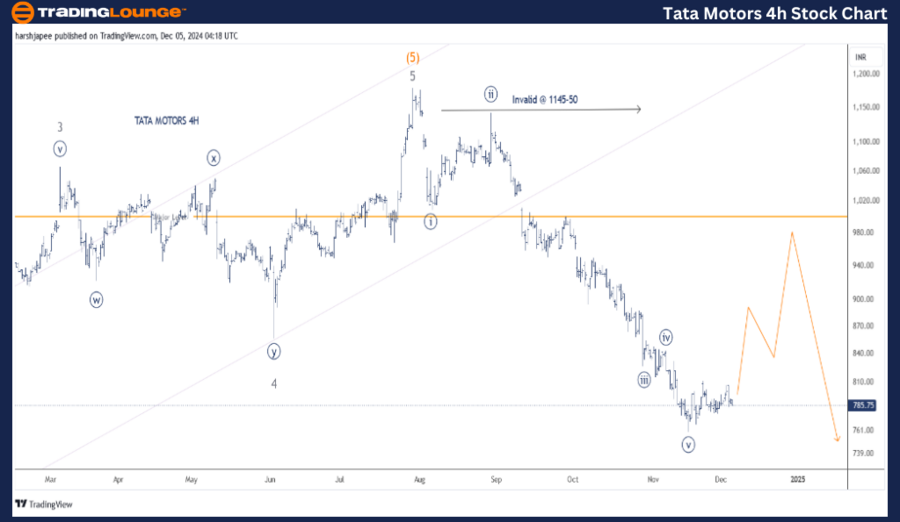
TATA MOTORS 4H Chart Technical Analysis and Potential Elliott Wave Counts

The 4H chart for TATA MOTORS highlights sub-waves following the termination of Minor Wave 3 Grey near the 1070 level in March 2024. Wave 4 appears to have been a combination pattern, followed by a potential impulse Wave 5 reaching the 1145-50 range.

The price action demonstrates an impulse drop from the 1145-50 high, suggesting a potential trend reversal. Alternatively, the entire structure from the Minor Wave 3 high might represent an expanded flat, now either completed or nearing completion around the 770 level.

If the expanded flat scenario is valid, the stock may soon pivot higher and push through the 1145-50 zone.

Technical Analyst: Harsh Japee

Source: visit Tradinglounge.com and learn From the Experts Join TradingLounge Here 

Previous: HDFCBANK Elliott Wave Technical Analysis 

VALUE Offer - Buy 1 Month & Get 3 Months!Click here

Access 7 Analysts Over 200 Markets Covered. Chat Room With Support

TATA-MOTORS-4h-stock...


Conclusion:

TATA MOTORS appears to have completed a potential impulse wave from the 1145-50 high down to the 770 level. A reversal or upward move is anticipated from the current levels shortly.

Related

Euro/U.S. Dollar Forex Trading Strategies: Elliott Wave Technical Analysis for the EURUSD Currency Pair, Focusing Charts

Euro/U.S. Dollar Forex Trading Strategies: Elliott Wave Technical Analysis for the EURUSD Currency Pair, Focusing Charts

This article provides a comprehensive Elliott Wave analysis for the EURUSD currency pair, focusing o...

Read More >
Unlocking ASX Trading Success: JAMES HARDIE INDUSTRIES PLC - JHX Stock Analysis & Elliott Wave Technical Forecast

Unlocking ASX Trading Success: JAMES HARDIE INDUSTRIES PLC - JHX Stock Analysis & Elliott Wave Technical Forecast

Explore an in-depth Elliott Wave analysis of ASX: JHX (James Hardie Industries), focusing on price t...

Read More >
Silver Commodity Elliott Wave Technical Analysis - XAGUSD Pair forecast and Buying Opportunities with clear Chart Analysis

Silver Commodity Elliott Wave Technical Analysis - XAGUSD Pair forecast and Buying Opportunities with clear Chart Analysis

This article provides an in-depth Elliott Wave analysis of the silver market, offering key insights ...

Read More >
DOW JONES Market Analysis - DJI Index Elliott Wave Technical Analysis | Dow Jones Stocks financial news

DOW JONES Market Analysis - DJI Index Elliott Wave Technical Analysis | Dow Jones Stocks financial news

This analysis provides an in-depth look at the Dow Jones DJI using Elliott Wave theory on day and we...

Read More >
U.S.Dollar/Swiss Franc (USD/CHF) Elliott Wave Technical Analysis Trading Lounge: In-Depth Technical Insights

U.S.Dollar/Swiss Franc (USD/CHF) Elliott Wave Technical Analysis Trading Lounge: In-Depth Technical Insights

Our USD/CHF Elliott Wave Analysis provides traders with valuable insights into the current market dy...

Read More >

Buy 1 Month

Get 3 Months!

Special Offer:

Trade Recommendations

Unleash the power of deversified trading with our comprehensive portfolio, covering:

  • Stock Trades
  • Crypto Trades
  • Forex Trades
  • Commodity Trades
Elliott Wave Analysis

Gain a competive edge with expert insights in to:

  • Global Indices
  • US Stocks & ASX Stocks
  • Forex & Crypto
  • Commodities
Top-Notch Trading Tools

Equip yourself with the tools of success:

  • Social Chat
  • Elliott Wave Algorithm
  • Screener
  • TradingLevels
  • Trading Game
7 Elliott Wave Analysts

Stay ahead of the market with daily charts and insightful videos
-Your secret to strategic trading!

JOIN HERE


Welcome to TradingLounge (ASIC A.R.No. 321187), specialists in trades, trading education and technical analysis, covering stocks, indices, commodities, forex and cryptocurrencies.

When you join TradingLounge you have access to everything we offer, including trade tools, educational content and a social platform to chat with like-minded investors.

Read more

@Copyright 2024 by tradinglounge.com

Contact Us

Australian no: 02 4787 6020

International no: +61 (2) 47876020

Pay with:

Find us on