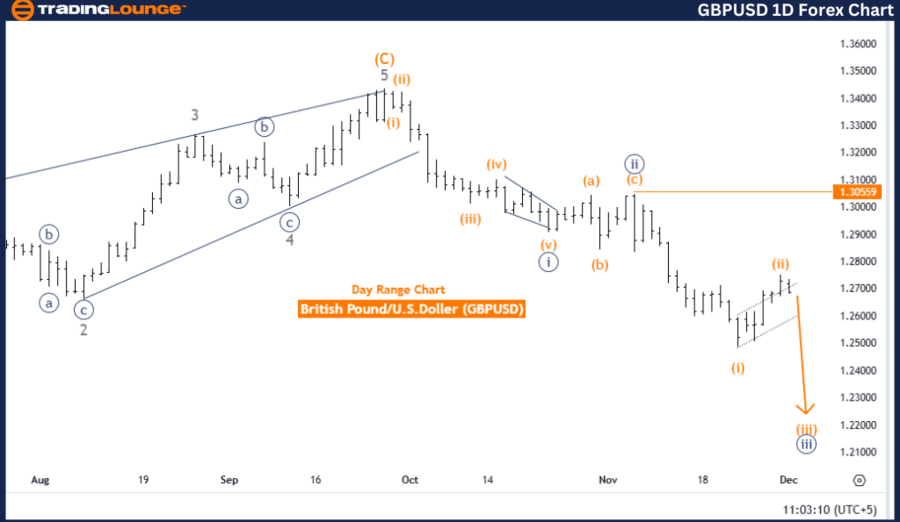
British Pound/U.S. Dollar GBPUSD Elliott Wave Analysis: Tradinglounge Analysis Daily Chart
GBPUSD Elliott Wave Technical Analysis
Function: Trend
Mode: Impulsive
Structure: Orange Wave 3
Position: Navy Blue Wave 3
Next Higher Degree Direction: Orange Wave 4
Details: Orange wave 2 appears complete, initiating orange wave 3 of navy blue wave 3.
Wave Cancel Invalidation Level: 1.30502
Analysis Overview
The daily chart analysis of GBPUSD, based on Elliott Wave theory, highlights a robust impulsive trend currently in progress. The wave structure points to orange wave 3 actively forming after the completion of orange wave 2, signaling strong upward momentum.
Key Observations
Position Within the Wave Cycle:
- GBPUSD is progressing within navy blue wave 3, with orange wave 3 actively developing.
- This phase underscores a strong bullish trend typical of an impulsive Elliott Wave structure.
Future Projections:
- Upon the completion of orange wave 3, the market is expected to enter orange wave 4, initiating a corrective phase within the ongoing bullish trend.
Risk Management:
- The invalidation level is set at 1.30502.
- If the price drops to this level, the current Elliott Wave count and bullish perspective will be invalidated, providing a key reference for trend evaluation and risk control.
Conclusion
The GBPUSD Elliott Wave analysis for the daily chart indicates a robust bullish impulsive trend, with orange wave 3 of navy blue wave 3 currently active. The completion of orange wave 2 marked the start of this upward progression.
Key Takeaways
- Bullish Trend: The bullish outlook holds as long as the price remains above 1.30502.
- Further Gains Expected: The ongoing progression of orange wave 3 suggests additional upward momentum before transitioning to the corrective orange wave 4 phase.
This analysis provides valuable insights for identifying trends and implementing strategic risk management in GBPUSD trading.

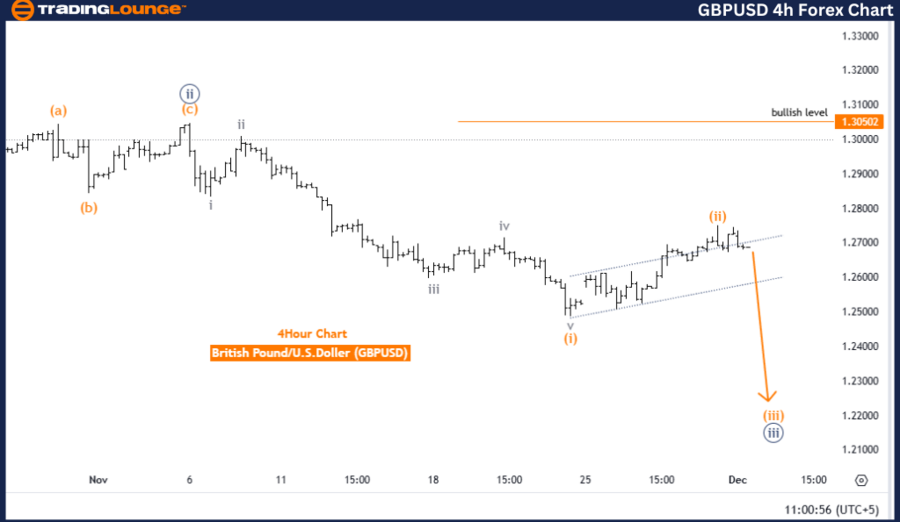
British Pound/U.S. Dollar GBPUSD Elliott Wave Analysis: Tradinglounge Analysis 4-Hour Chart
GBPUSD Elliott Wave Technical Analysis
Function: Trend
Mode: Impulsive
Structure: Orange Wave 3
Position: Navy Blue Wave 3
Next Higher Degree Direction: Orange Wave 4
Details: Orange wave 2 appears complete, initiating orange wave 3 of navy blue wave 3.
Wave Cancel Invalidation Level: 1.30502
Analysis Overview
The 4-hour Elliott Wave analysis of GBPUSD reinforces the impulsive trend identified in the daily chart. The wave structure confirms the formation of orange wave 3 following the completion of orange wave 2, signaling continued bullish momentum.
Key Observations
Current Wave Position:
- GBPUSD is actively progressing in navy blue wave 3, with orange wave 3 developing further.
- This phase is characterized by strong impulsive movements, consistent with the dynamics of Elliott Wave analysis.
Future Projections:
- Once orange wave 3 concludes, the trend is expected to shift into orange wave 4, representing a corrective phase within the ongoing bullish movement.
Risk Management:
- The invalidation level for this wave count is 1.30502.
- A drop to this level would nullify the current Elliott Wave setup and bullish outlook, making it critical for trend validation and risk assessment.
Conclusion
The GBPUSD 4-hour chart Elliott Wave analysis underscores a strong bullish impulsive trend, with orange wave 3 of navy blue wave 3 actively progressing. The completion of orange wave 2 initiated this upward trajectory.
Key Takeaways
- Bullish Continuation: The bullish forecast remains intact as long as the price holds above 1.30502.
- Additional Gains Likely: Orange wave 3 is anticipated to drive further upward momentum before transitioning to the corrective phase of orange wave 4.
This analysis offers practical insights for understanding trends and managing risks effectively in GBPUSD trading.
Technical Analyst: Malik Awais
Source: visit Tradinglounge.com and learn From the Experts Join TradingLounge Here
Previous: EURGBP Elliott Wave Technical Analysis
VALUE Offer - Buy 1 Month & Get 3 Months!Click here
Access 7 Analysts Over 200 Markets Covered. Chat Room With Support
