ASX: REA GROUP LTD – Elliott Wave Analysis (1D Chart)

Greetings! In today's Elliott Wave analysis, we provide an update on the Australian Stock Exchange (ASX) focusing on REA GROUP LTD – REA. Our analysis indicates that wave 2-red has likely ended, and wave 3-red may propel much higher.

ASX: REA GROUP LTD – Elliott Wave Technical Analysis

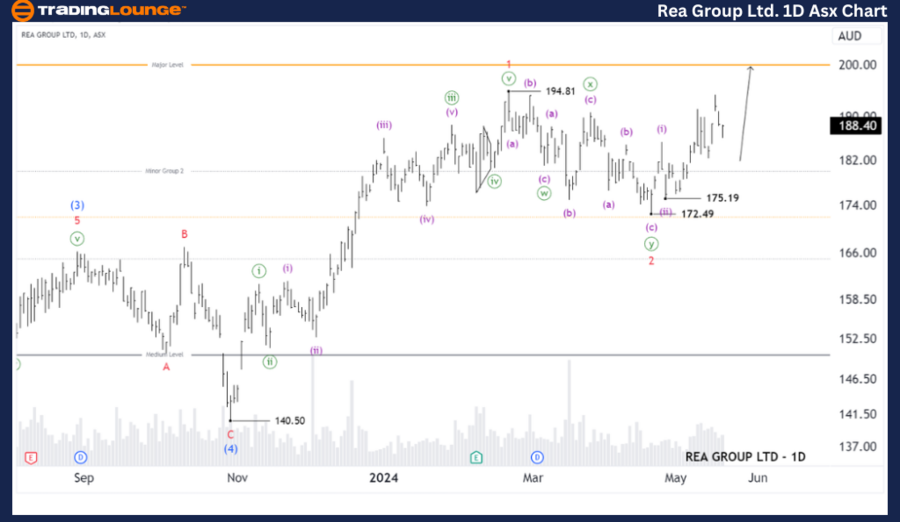
ASX: REA GROUP LTD – 1D Chart (Semilog Scale) Analysis

Function: Major trend (Minor degree, red)

Mode: Motive

Structure: Impulse

Position: Wave (iii)-purple of Wave 3-red

Details: The current outlook suggests that wave 2-red has recently concluded, and wave 3-red is now in progress, expected to move significantly higher. This wave is subdividing into waves (i) and (ii)-purple, both of which have ended. Currently, wave (iii)-purple is emerging, poised to drive the price higher.

Invalidation point: 175.19

Rea-Group-Ltd-1D-asx...


ASX: REA GROUP LTD – Elliott Wave Technical Analysis (4-Hour Chart)

ASX: REA GROUP LTD – Elliott Wave Technical Analysis

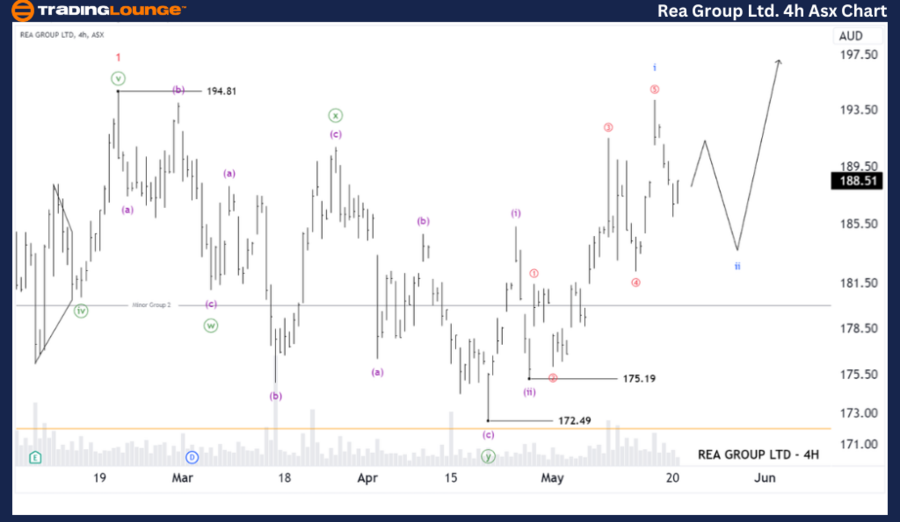
ASX: REA GROUP LTD – 4-Hour Chart Analysis

Function: Major trend (Minuette degree, purple)

Mode: Motive

Structure: Impulse

Position: Wave ii-blue of Wave (iii)-purple

Details: In the shorter-term analysis, wave 2-red has completed in the form of ((w)), ((x)), ((y))-green. Now, wave 3-red is unfolding. It has subdivided into waves (i) and (ii)-purple, which are completed. Currently, wave (iii)-purple is forming and further subdividing into wave i-blue. Wave ii-blue is in progress, expected to push slightly lower before wave iii-blue resumes the upward movement.

Invalidation point: 175.19

Technical Analyst: Hua (Shane) Cuong, CEWA-M (Master’s Designation).

Source: visit Tradinglounge.com and learn From the Experts Join TradingLounge Here 

Previous: NEWMONT CORPORATION - NEM Elliott Wave Analysis

Special Trial Offer - 0.76 Cents a Day for 3 Months! Click here

Access 7 Analysts Over 170 Markets Covered. Chat Room With Support

Rea-Group-Ltd-4hr-as...

Conclusion:  

Our analysis, forecast of contextual trends, and short-term outlook for ASX: REA GROUP LTD – REA aim to provide readers with insights into the current market trends and how to capitalize on them effectively. We offer specific price points that act as validation or invalidation signals for our wave count, enhancing the confidence in our perspective. By combining these factors, we strive to offer readers the most objective and professional perspective on market trends.

Related

ASX: SOUTH32 LIMITED (S32) Elliott Wave Technical Analysis  – Stock Price Prediction, Trading Strategy, and Forecast Insights

ASX: SOUTH32 LIMITED (S32) Elliott Wave Technical Analysis – Stock Price Prediction, Trading Strategy, and Forecast Insights

This article provides an in-depth Elliott Wave analysis for ASX: SOUTH32 LIMITED (S32). We examine t...

Read More >
Copper Commodity Elliott Wave Technical Analysis : Undergoing a Pullback Within a Larger Bullish Structure

Copper Commodity Elliott Wave Technical Analysis : Undergoing a Pullback Within a Larger Bullish Structure

Copper is undergoing a pullback within a larger bullish Elliott Wave structure that began in July 20...

Read More >
Polkadot/U.S. dollar(DOTUSD) Elliott Wave Technical Analysis 25 January 24

Polkadot/U.S. dollar(DOTUSD) Elliott Wave Technical Analysis 25 January 24

Today's crypto Chart by TradingLounge for Polkadot and U.S. dollar Elliott Wave Technical Analys...

Read More >
ChainLink/U.S. dollar(LINKUSD) Elliott Wave Technical Analysis 24 January 24

ChainLink/U.S. dollar(LINKUSD) Elliott Wave Technical Analysis 24 January 24

ChainLink and U.S. dollar Elliott Wave Technical Analysis dated 24 January 24 in which TradingLounge...

Read More >
Spotify Technology S.A. (SPOT) Elliott Wave Technical Analysis: Chart Trends, Identifies Key Support levels, and Provides Insights

Spotify Technology S.A. (SPOT) Elliott Wave Technical Analysis: Chart Trends, Identifies Key Support levels, and Provides Insights

Get the latest Spotify (SPOT) stock analysis using Elliott Wave Theory. Our detailed report covers d...

Read More >
HCL Technologies Stock Analysis: HCLTECH Elliott Wave Technical Analysis Covers Chart Insights and a Detailed Forecast

HCL Technologies Stock Analysis: HCLTECH Elliott Wave Technical Analysis Covers Chart Insights and a Detailed Forecast

This article provides a comprehensive Elliott Wave analysis of HCL Technologies (HCLTECH) stock. It ...

Read More >

Buy 1 Month

Get 3 Months!

Special Offer:

Trade Recommendations

Unleash the power of deversified trading with our comprehensive portfolio, covering:

  • Stock Trades
  • Crypto Trades
  • Forex Trades
  • Commodity Trades
Elliott Wave Analysis

Gain a competive edge with expert insights in to:

  • Global Indices
  • US Stocks & ASX Stocks
  • Forex & Crypto
  • Commodities
Top-Notch Trading Tools

Equip yourself with the tools of success:

  • Social Chat
  • Elliott Wave Algorithm
  • Screener
  • TradingLevels
  • Trading Game
7 Elliott Wave Analysts

Stay ahead of the market with daily charts and insightful videos
-Your secret to strategic trading!

JOIN HERE


Welcome to TradingLounge (ASIC A.R.No. 321187), specialists in trades, trading education and technical analysis, covering stocks, indices, commodities, forex and cryptocurrencies.

When you join TradingLounge you have access to everything we offer, including trade tools, educational content and a social platform to chat with like-minded investors.

Read more

@Copyright 2024 by tradinglounge.com

Contact Us

Australian no: 02 4787 6020

International no: +61 (2) 47876020

Pay with:

Find us on