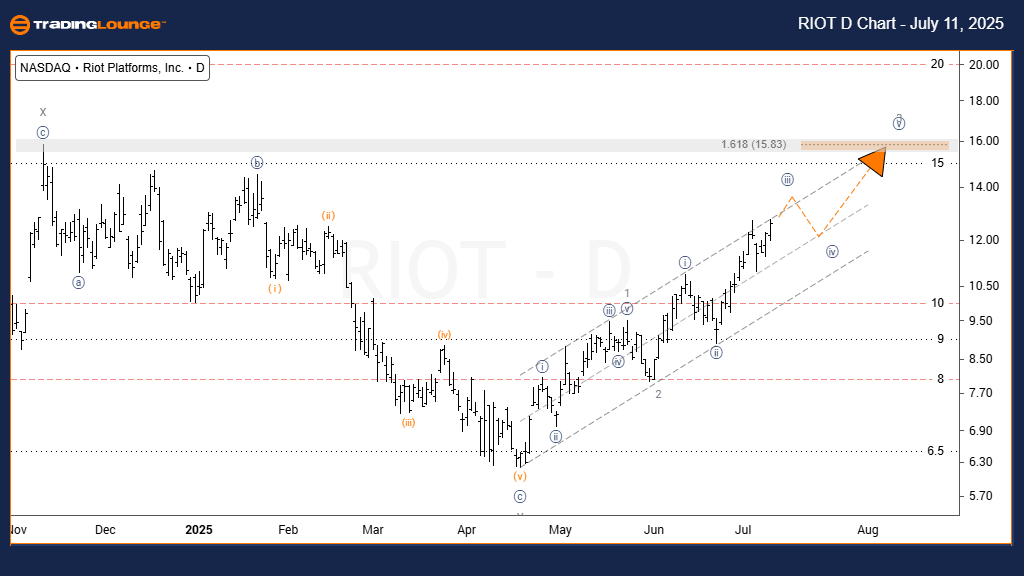
Riot Platforms, Inc. (RIOT) – Elliott Wave Forecast - Trading Lounge (Daily Chart)
RIOT Daily Chart Analysis – Technical Overview
Function: Trend
Mode: Motive
Structure: Impulsive
Position: Wave {v} of 3
Direction: Bullish
Details: Wave {v} of 3 projected to reach the 161.8% Fibonacci extension of Wave 1
Riot Platforms, Inc. (RIOT) shows sustained bullish momentum on the daily chart, actively advancing in Wave {v} of 3. A breakout above the resistance trendline is anticipated, signaling the likely continuation of the current impulsive phase. Based on Elliott Wave principles, Wave {v} of 3 often extends and could potentially hit the 161.8% Fibonacci extension of Wave 1. This movement supports a favorable short-term bullish outlook, aligning with upward momentum and offering a promising setup for traders.
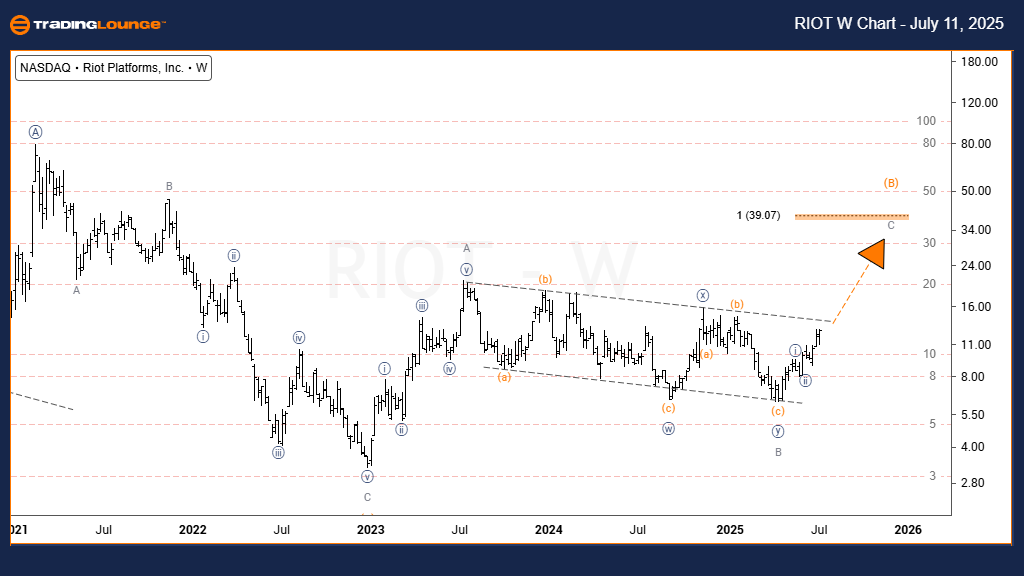
Riot Platforms, Inc. (RIOT) – Elliott Wave Forecast (Weekly Chart)
RIOT Weekly Chart Analysis – Technical Overview
Function: Trend
Mode: Motive
Structure: Impulsive
Position: Wave C of (B)
Direction: Bullish
Details: After breaking out of a price channel, the market is positioned to complete Wave C of (B) with a strong rally
On the weekly chart, RIOT continues its bullish path within an impulsive wave structure, identified as Wave C of (B). This movement follows a confirmed breakout from a parallel channel, often a catalyst for significant upward price action. Wave C is expected to approach the 100% Fibonacci projection of Wave (A), maintaining a bullish technical framework. Investors should stay alert for short-term resistance levels and potential consolidation before the uptrend resumes.
Technical Analyst: Dhiren Pahuja
Visit: TradingLounge.com for detailed analysis and market updates.
Previous: ServiceNow Inc. (NOW) Elliott Wave Technical Analysis
VALUE Offer - $1 for 2 Weeks then $29 a month!Click here
Access 7 Analysts Over 200 Markets Covered. Chat Room With Support