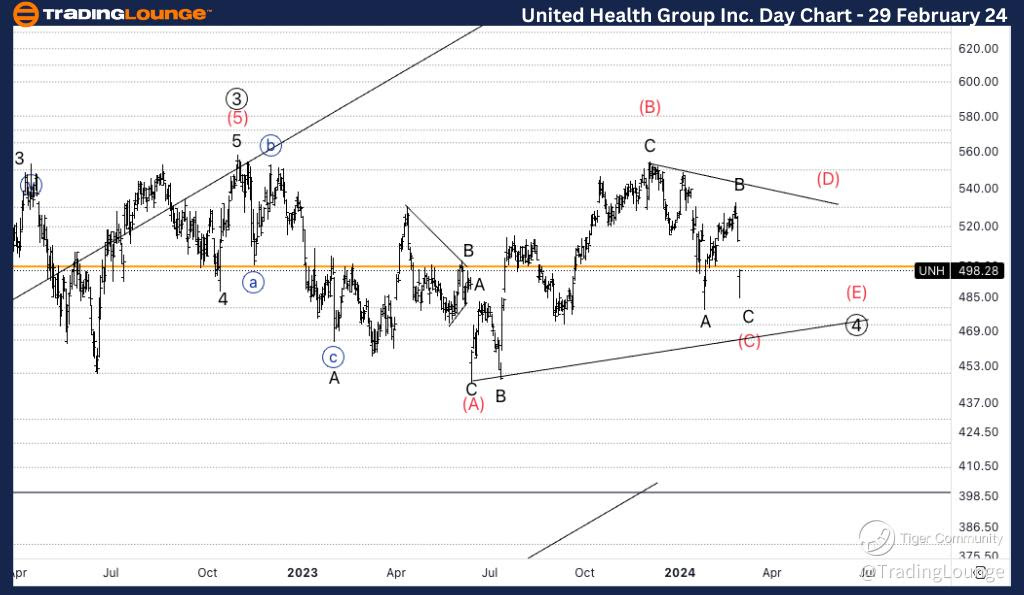
UNH Elliott Wave Analysis Trading Lounge Daily Chart, 29 February 24

Welcome to our UNH Elliott Wave Analysis Trading Lounge, your go-to resource for in-depth insights into UnitedHealth Group Inc. (UNH) using Elliott Wave Technical Analysis. As of the Daily Chart on 29th February 2024, we delve into significant trends driving the market.

UnitedHealth Group Inc., (UNH) Daily Chart Analysis

UNH Elliott Wave Technical Analysis

FUNCTION: Counter Trend

MODE: Corrective

STRUCTURE: Triangle

POSITION: Wave (C) of 4.  

DIRECTION: Sideways continuation in the triangle.  

DETAILS: We have been correcting ever since the end of 2022, and at this point we seem to be “dancing” around Trading Level 5 at 500$. In this daily chart we entertain the possibility of a triangle in wave 4, meaning we could see sideways continuation until the triangle resolves.

UNH Technical Analysis – Daily Chart

In terms of wave dynamics, we identify a counter trend function with a corrective structure, particularly a triangle pattern. The current position is in Wave (C) of 4, indicating sideways continuation within the triangle. Since the end of 2022, we've been in a correction phase, and currently, we're hovering around Trading Level 5 at $500. The daily chart presents the possibility of a triangle formation in wave 4, suggesting sideways movement until the triangle resolves.

UnitedHealth-Day-Sto...


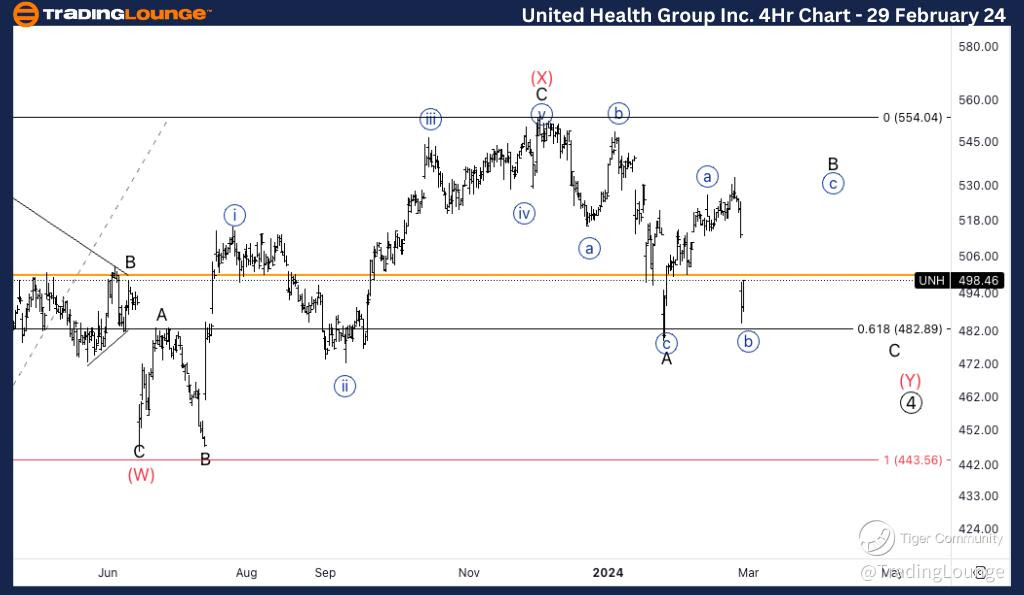
UNH Elliott Wave Analysis Trading Lounge 4Hr Chart, 29 February 24

UnitedHealth Group Inc., (UNH) 4Hr Chart

UNH Elliott Wave Technical Analysis

FUNCTION: Counter Trend

MODE: Corrective

STRUCTURE: Complex

POSITION: Wave B of (Y).

DIRECTION: Upside in wave C of (Y).

DETAILS: Here we entertain the possibility of a complex correction in Primary wave 4, where we could be near the end, as we have found support on 0.618 (Y) vs. (W). We could either continue higher in wave {c} of B to then continue lower towards equality of (Y) vs. (W) at 443, or else we could already have a bottom in place.  

Here, we explore a counter trend mode with a corrective and complex structure, potentially indicating Wave B of (Y). The direction is upside in wave C of (Y). We consider the prospect of a complex correction in Primary wave 4, nearing its end, with support identified at 0.618 (Y) versus (W). We anticipate either further upside in wave {c} of B followed by a downturn towards equality of (Y) versus (W) at $443 or a potential bottom already in place.

Technical Analyst: Alessio Barretta

Source: visit Tradinglounge.com and learn From the Experts Join TradingLounge Here 

See Previous: Apple Inc. 

TradingLounge Once Off SPECIAL DEAL: Here > 1 month Get 3 months.   

UnitedHealth-4Hr-Sto...

Related

Soybeans Commodity Elliott Wave Technical Analysis Provides Insights into the Ongoing Downtrend and Potential market trends,

Soybeans Commodity Elliott Wave Technical Analysis Provides Insights into the Ongoing Downtrend and Potential market trends,

Explore in-depth Soybean Elliott Wave Analysis, covering recent price movements, Elliott Wave patter...

Read More >
Euro/ U.S. Dollar (EURUSD) Forex Elliott Wave Technical Analysis: Bullish Trend Forecast and Proven Trading Strategies

Euro/ U.S. Dollar (EURUSD) Forex Elliott Wave Technical Analysis: Bullish Trend Forecast and Proven Trading Strategies

Get an in-depth EURUSD Elliott Wave analysis for both daily and 4-hour charts. Understand the curren...

Read More >
Texas Instruments Inc.(TXN:NASDAQ) Elliott Wave Technical Analysis 18 December 23

Texas Instruments Inc.(TXN:NASDAQ) Elliott Wave Technical Analysis 18 December 23

Texas Instruments Inc.(TXN: NASDAQ) Elliott Wave Technical Analysis with 4-Hour and 1-hour Chart dat...

Read More >
In-Depth Elliott Wave Analysis of Newmont Corporation (ASX:NEM): Identifying Wave 3 Targets and Strategic Trading Opportunities

In-Depth Elliott Wave Analysis of Newmont Corporation (ASX:NEM): Identifying Wave 3 Targets and Strategic Trading Opportunities

This article provides an in-depth Elliott Wave technical analysis of Newmont Corporation (ASX: NEM),...

Read More >
 Iron Ore Commodity Elliott Wave Technical Analysis: Bullish Impulse Set to Resume

Iron Ore Commodity Elliott Wave Technical Analysis: Bullish Impulse Set to Resume

In the realm of iron ore trading, as of February 22, 2024, Elliott Wave analysis reveals a potential...

Read More >
THETAUSD Crypto Price News and Elliott Wave Technical Analysis for Today – Market Trends and Forecast Updates

THETAUSD Crypto Price News and Elliott Wave Technical Analysis for Today – Market Trends and Forecast Updates

This article provides an in-depth THETAUSD Elliott Wave analysis, highlighting potential bullish bre...

Read More >

$1 for 2 Weeks

then $29 a month!

What a Special Offer!

Trade Recommendations

Unleash the power of deversified trading with our comprehensive portfolio, covering 250+ markets:

  • Stock Trades
  • Crypto Trades
  • Forex Trades
  • Commodity Trades
Elliott Wave Analysis

Gain a competitive edge with expert insights and AI-powered Elliott Wave charting into:

  • Global Indices
  • US Stocks & ASX Stocks
  • Forex & Crypto
  • Commodities
Top-Notch Trading Tools

Equip yourself with the tools of success:

  • Real-time Chat rooms
  • Elliott Wave Algorithm
  • Portfolio tools
  • TradingLevels
  • Screener
  • Trading Game
7 Elliott Wave Analysts

Stay ahead of the market with daily charts and insightful videos
Your secret to strategic trading!

JOIN HERE


Welcome to TradingLounge (ASIC A.R.No. 321187), specialists in trades, trading education and technical analysis, covering stocks, indices, commodities, forex and cryptocurrencies.

When you join TradingLounge you have access to everything we offer, including trade tools, educational content and a social platform to chat with like-minded investors.

Read more

@Copyright 2024 by tradinglounge.com

Contact Us

Australian no: 02 4787 6020

International no: +61 (2) 47876020

Pay with:

Find us on