07Jul

BHP GROUP LIMITED Stock Forecast: Elliott Wave Analysis Predicts Bullish Move for ASX:BHP with Wave 3 Upside Potential

ASX: BHP GROUP LIMITED - BHP Elliott Wave Analysis 

Our latest Elliott Wave analysis for BHP GROUP LIMITED (ASX:BHP) highlights a potential bullish movement in the stock price. Based on the completed wave 2-orange, which seems to have formed a classic Zigzag pattern, there is a strong indication that wave 3-orange has started to develop. This analysis covers our projected target price range and critical support levels that validate the bullish scenario.


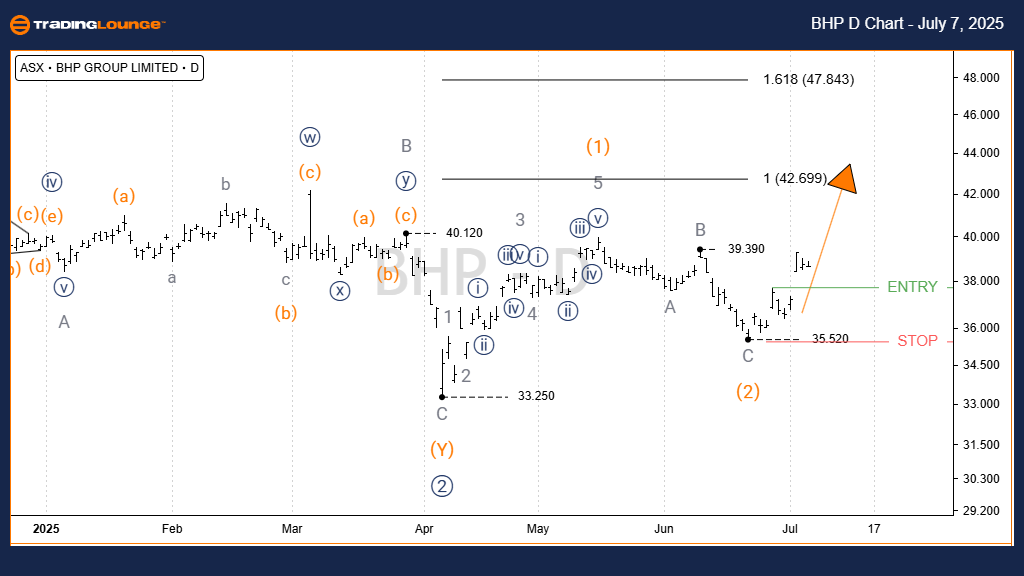
ASX: BHP GROUP LIMITED - BHP Daily Chart (1D, Semilog Scale) Overview

Wave Function: Intermediate Trend (Orange Degree)

Wave Mode: Motive

Structure Type: Impulse

Wave Position: Wave 3-orange

Technical Breakdown:

Wave 1-orange began from the low of 33.25 and formed a complete five-wave impulsive structure. Subsequently, wave 2-orange is likely completed as a grey ABC Zigzag correction. This technical progression reinforces the possibility of wave 3-orange advancing next, with price targets estimated between 42.70 and 47.84. The bullish scenario remains intact as long as BHP stays above the key support level of 35.52.

Critical Invalidation Level: 35.52

BHP-d-asx-chart-0707...


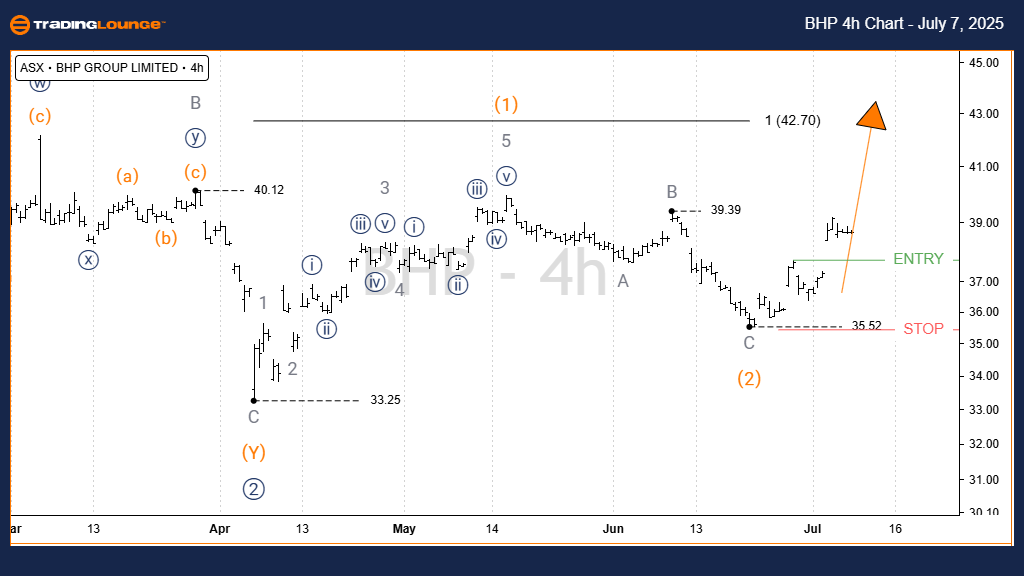
ASX: BHP GROUP LIMITED - Elliott Wave Analysis on 4-Hour Chart

TradingLounge 4-Hour Chart Review

Analyzing the 4-hour timeframe, the structure remains aligned with the daily chart analysis. A potential long position becomes more favorable if BHP breaks above the entry confirmation zone, signaling the continuation of wave 3-orange in the upward direction.

Wave Function: Intermediate Trend (Orange Degree)

Wave Mode: Motive

Structure Type: Impulse

Wave Position: Wave 3-orange

Critical Invalidation Level: 35.52

Technical Analyst: Hua (Shane) Cuong, CEWA‑M (Certified Elliott Wave Analyst – Master Level)

Source: Visit Tradinglounge.com and learn from the Experts. Join TradingLounge Here 

See Previous: Newmont Corporation Elliott Wave Technical Analysis

VALUE Offer - Buy 1 Month & Get 3 Months!Click here

Access 7 Analysts Over 200 Markets Covered. Chat Room With Support

BHP-4h-asx-chart-070...


Conclusion

This Elliott Wave technical analysis of BHP GROUP LIMITED (ASX:BHP) integrates both short-term and long-term chart patterns. We have defined key support and resistance zones that validate or challenge the ongoing bullish wave structure. These levels help traders and investors align with a technically backed and objective market strategy.

Related

Elliott Wave Analysis for INSURANCE AUSTRALIA GROUP LIMITED (IAG) –  Technical Outlook, Wave Structure, Price Target & Market Trends

Elliott Wave Analysis for INSURANCE AUSTRALIA GROUP LIMITED (IAG) – Technical Outlook, Wave Structure, Price Target & Market Trends

Elliott Wave analysis for ASX: IAG, outlining key market trends, wave structure, and price targets. ...

Read More >
Explores the Stock’s Current Market Structure: Apple Inc. (AAPL) Stocks Elliott Wave Technical Analysis

Explores the Stock’s Current Market Structure: Apple Inc. (AAPL) Stocks Elliott Wave Technical Analysis

This comprehensive Elliott Wave analysis of Apple Inc. (AAPL) explores the stock’s current market s...

Read More >
U.S.Dollar /Canadian Dollar(USD/CAD)  Forex Elliott Wave Technical Analysis

U.S.Dollar /Canadian Dollar(USD/CAD)  Forex Elliott Wave Technical Analysis

Elliott Wave Analysis of the USD/CAD currency pair, providing key insights into its potential movem...

Read More >
Silver Price Forecast: Elliott Wave Analysis Predicts Strong Wave 3 Breakout After Completing Wave 2 Correction Above $28

Silver Price Forecast: Elliott Wave Analysis Predicts Strong Wave 3 Breakout After Completing Wave 2 Correction Above $28

Silver remains in a bullish uptrend, currently correcting before an expected wave 3 breakout above 2...

Read More >
Ethereum/ U.S. dollar(ETHUSD) Elliott Wave Technical Analysis 17 November 23

Ethereum/ U.S. dollar(ETHUSD) Elliott Wave Technical Analysis 17 November 23

Ethereum/ U.S. dollar(ETHUSD) Elliott Wave Technical Analysis 17 November 23 with daily chart,Ethere...

Read More >
Learn Whether ANZ Group Holdings Limited Shares are a Buy or Sell – ANZ Elliott Wave Analysis & Technical Forecast

Learn Whether ANZ Group Holdings Limited Shares are a Buy or Sell – ANZ Elliott Wave Analysis & Technical Forecast

This Elliott Wave analysis of ASX: ANZ GROUP HOLDINGS LIMITED provides a detailed breakdown of ANZ s...

Read More >

$1 for 2 Weeks

then $29 a month!

What a Special Offer!

Trade Recommendations

Unleash the power of deversified trading with our comprehensive portfolio, covering 250+ markets:

  • Stock Trades
  • Crypto Trades
  • Forex Trades
  • Commodity Trades
Elliott Wave Analysis

Gain a competitive edge with expert insights and AI-powered Elliott Wave charting into:

  • Global Indices
  • US Stocks & ASX Stocks
  • Forex & Crypto
  • Commodities
Top-Notch Trading Tools

Equip yourself with the tools of success:

  • Real-time Chat rooms
  • Elliott Wave Algorithm
  • Portfolio tools
  • TradingLevels
  • Screener
  • Trading Game
7 Elliott Wave Analysts

Stay ahead of the market with daily charts and insightful videos
Your secret to strategic trading!

JOIN HERE


Welcome to TradingLounge (ASIC A.R.No. 321187), specialists in trades, trading education and technical analysis, covering stocks, indices, commodities, forex and cryptocurrencies.

When you join TradingLounge you have access to everything we offer, including trade tools, educational content and a social platform to chat with like-minded investors.

Read more

@Copyright 2024 by tradinglounge.com

Contact Us

Australian no: 02 4787 6020

International no: +61 (2) 47876020

Pay with:

Find us on