04Jul

Newmont Corporation Elliott Wave Analysis: ASX:NEM Price Forecast, Bullish Trend, Wave Targets, Technical Outlook, and Key Levels

ASX: NEM – NEWMONT CORPORATION Elliott Wave Analysis

Hello,
This updated Elliott Wave analysis of Newmont Corporation (ASX:NEM) reviews the current wave structure based on the Australian Stock Exchange listing. Our latest evaluation indicates that ASX:NEM is moving through wave three of a larger trend. This report delivers precise price targets and a key invalidation level, essential for traders applying Elliott Wave principles to forecast market shifts.

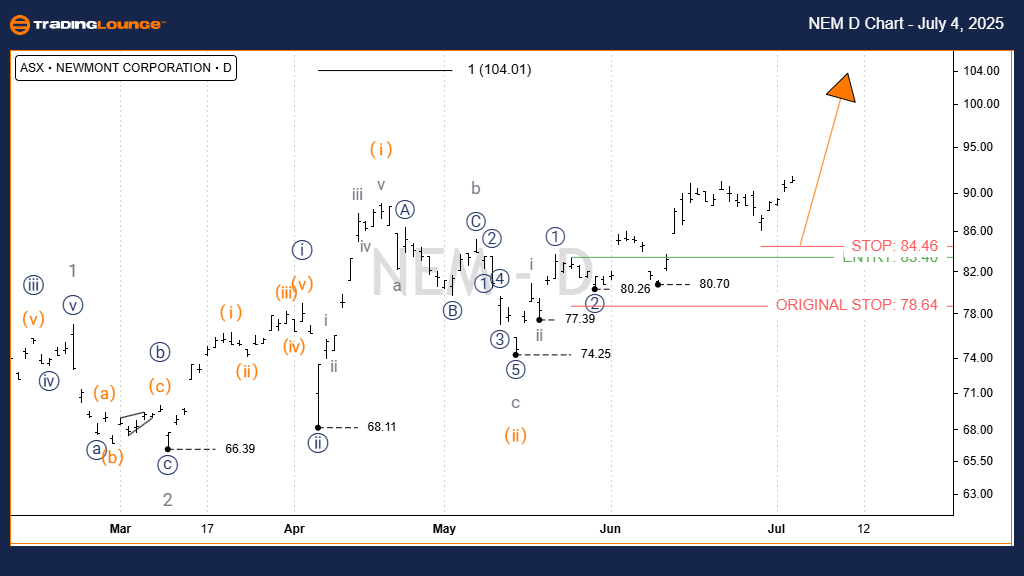
Newmont Corporation (ASX:NEM) 1D Chart (Semilog Scale) – Technical Overview

Function: Major trend (Minor degree, grey)

Mode: Motive

Structure: Impulse

Wave Position: Wave iii) - orange of Wave iii)) - navy of Wave 3 - grey

Key Observations:

  • The low at 74.25 likely marks the end of wave ii) - orange, forming a completed zigzag correction (a, b, c - grey).
  • From this pivot, wave iii) - orange is gaining upward momentum, with the primary upside target set at 100.00.

Critical Invalidation Level: 74.25

NEM-Asx-d-Chart-0407...


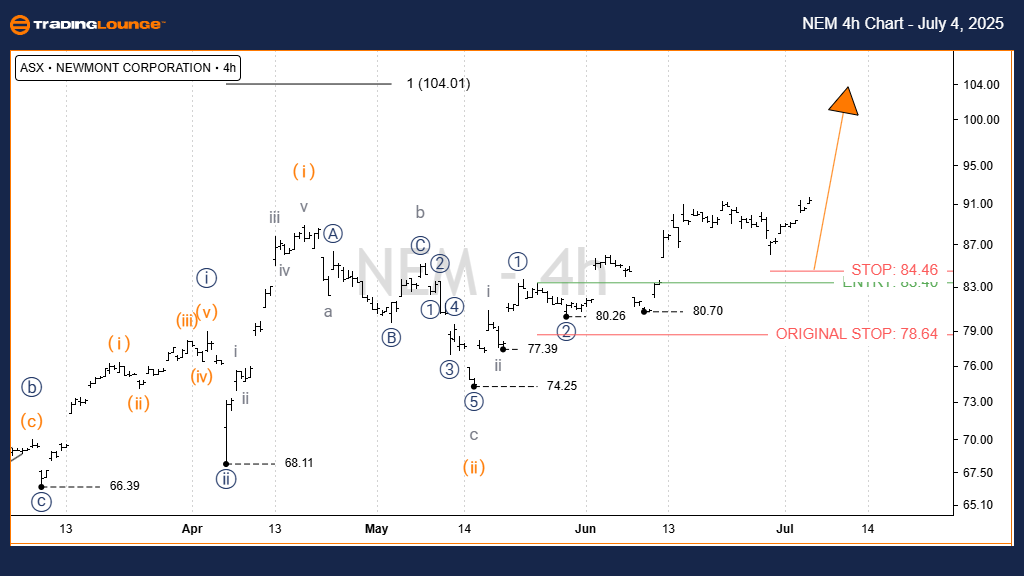
Newmont Corporation (ASX:NEM) 4-Hour Chart Analysis

Function: Major trend (Minor degree, grey)

Mode: Motive

Structure: Impulse

Wave Position: Wave iii) - orange of Wave ((iii)) - navy of Wave 3 - grey

Technical Insights:

  • The 4-hour time frame supports the upward wave continuation seen in the 1-day chart.
  • Wave iii) - orange is in a sustained bullish phase, aiming for 100.00.
  • On a shorter time horizon, wave iii - grey is also trending up, targeting a near-term level of 90.00.

Critical Invalidation Level: 74.25

Technical Analyst: Hua (Shane) Cuong, CEWA‑M (Certified Elliott Wave Analyst – Master Level)

Source: Visit Tradinglounge.com and learn from the Experts. Join TradingLounge Here 

See Previous: COLES GROUP LIMITED – COL Elliott Wave Technical Analysis

VALUE Offer - $1 for 2 Weeks then $29 a month!Click here

Access 7 Analysts Over 200 Markets Covered. Chat Room With Support

NEM-Asx-w-Chart-0407...


Conclusion

This Elliott Wave technical analysis for ASX: NEM provides actionable insights for traders and investors following Newmont Corporation. By outlining key validation and invalidation price levels, this analysis offers a structured view of potential trend developments.
The goal is to provide a reliable, transparent perspective for anyone leveraging an Elliott Wave trading strategy in today's market.

Related

Elliott Wave Technical  Analysis of Cardano (ADAUSD): Insights from Daily and H4 Technical Analysis

Elliott Wave Technical Analysis of Cardano (ADAUSD): Insights from Daily and H4 Technical Analysis

This article offers a comprehensive Elliott Wave analysis of Cardano (ADAUSD), providing key insight...

Read More >
ASX Trading Success: Sonic Healthcare Limited – SHL Stock Analysis & Elliott Wave Technical Forecast

ASX Trading Success: Sonic Healthcare Limited – SHL Stock Analysis & Elliott Wave Technical Forecast

This article provides an in-depth Elliott Wave analysis of Sonic Healthcare Limited (ASX: SHL). We h...

Read More >
Spotify Technology S.A. Stocks Elliott Wave Technical Analysis: Evaluate Current Trends and Forecast SPOT’s Future Price Direction

Spotify Technology S.A. Stocks Elliott Wave Technical Analysis: Evaluate Current Trends and Forecast SPOT’s Future Price Direction

This in-depth Spotify stock analysis applies Elliott Wave Theory to evaluate current trends and fore...

Read More >
The Elliott Wave Analysis for Texas Instruments Inc. (TXN) Reveals a Bullish Trend, Supported by Both the Daily and 1-hour Charts

The Elliott Wave Analysis for Texas Instruments Inc. (TXN) Reveals a Bullish Trend, Supported by Both the Daily and 1-hour Charts

Our Elliott Wave analysis for Texas Instruments Inc. (TXN) highlights a bullish trend, with both dai...

Read More >
NIFTY 50(INDIA) Index Elliott Wave Technical Analysis Provides Detailed Insights into current market trends

NIFTY 50(INDIA) Index Elliott Wave Technical Analysis Provides Detailed Insights into current market trends

The NIFTY 50 (India) Elliott Wave Analysis provides detailed insights into current market trends usi...

Read More >
INSURANCE AUSTRALIA GROUP LIMITED – IAG Stock Analysis & Elliott Wave Technical Forecast Trends, and Market Outlook 2025

INSURANCE AUSTRALIA GROUP LIMITED – IAG Stock Analysis & Elliott Wave Technical Forecast Trends, and Market Outlook 2025

ASX: IAG (Insurance Australia Group Limited) outlines the current market wave structure, forecasts p...

Read More >

$1 for 2 Weeks

then $29 a month!

What a Special Offer!

Trade Recommendations

Unleash the power of deversified trading with our comprehensive portfolio, covering 250+ markets:

  • Stock Trades
  • Crypto Trades
  • Forex Trades
  • Commodity Trades
Elliott Wave Analysis

Gain a competitive edge with expert insights and AI-powered Elliott Wave charting into:

  • Global Indices
  • US Stocks & ASX Stocks
  • Forex & Crypto
  • Commodities
Top-Notch Trading Tools

Equip yourself with the tools of success:

  • Real-time Chat rooms
  • Elliott Wave Algorithm
  • Portfolio tools
  • TradingLevels
  • Screener
  • Trading Game
7 Elliott Wave Analysts

Stay ahead of the market with daily charts and insightful videos
Your secret to strategic trading!

JOIN HERE


Welcome to TradingLounge (ASIC A.R.No. 321187), specialists in trades, trading education and technical analysis, covering stocks, indices, commodities, forex and cryptocurrencies.

When you join TradingLounge you have access to everything we offer, including trade tools, educational content and a social platform to chat with like-minded investors.

Read more

@Copyright 2024 by tradinglounge.com

Contact Us

Australian no: 02 4787 6020

International no: +61 (2) 47876020

Pay with:

Find us on