Hang Seng Index Elliott Wave Analysis Trading Lounge Day Chart
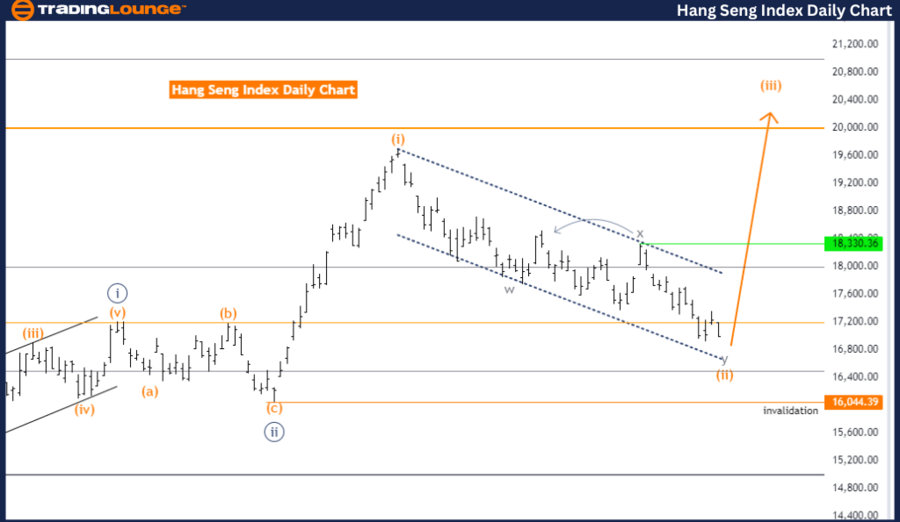
Hang Seng Index Daily Chart Analysis
Function: Counter Trend
Mode: Corrective
Structure: Orange Wave 2
Position: Navy Blue Wave 3
Direction Next Higher Degrees: Orange Wave 3
Orange Wave 2 remains active, nearing completion. The invalidation level for this wave is set at 16044.39.
Hang Seng Index Elliott Wave Technical Analysis
The Hang Seng Index day chart analysis indicates a counter-trend in a corrective mode. The focus is on Orange Wave 2's structure, positioned within Navy Blue Wave 3. This setup suggests a market correction phase within a broader trend, pointing to potential consolidation or retracement.
Details suggest Orange Wave 2 is close to concluding, indicating the market may soon end this corrective phase. The conclusion of Orange Wave 2 will signal the start of Orange Wave 3, marking a return to the primary trend.
The next higher-degree direction is expected to be Orange Wave 3. This shift from the current corrective phase to a new impulsive phase is likely to bring renewed momentum and potential trading opportunities.
A key aspect of this analysis is the wave cancellation invalidation level, set at 16044.39. This level is crucial for confirming the current wave analysis. If the market price drops below this point, the current wave count would be invalidated, requiring a reevaluation of the wave structure and potentially altering the market outlook.
In summary, the Hang Seng Index day chart analysis shows the market in a corrective phase within Orange Wave 2, positioned in Navy Blue Wave 3. This phase appears close to ending, indicating an impending transition to Orange Wave 3. The wave cancel invalidation level of 16044.39 is a critical threshold for validating this analysis and reassessing the wave structure if exceeded.
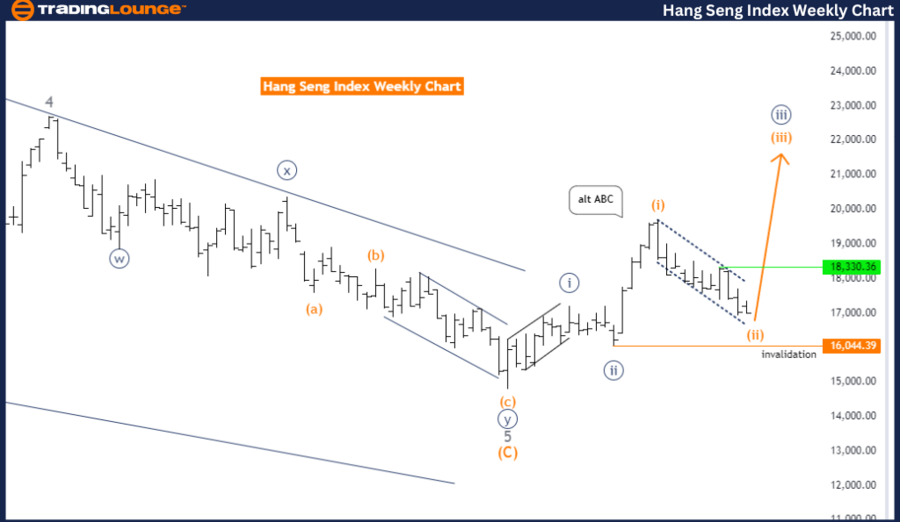
Hang Seng Index Elliott Wave Analysis Trading Lounge Weekly Chart
Hang Seng Index Elliott Wave Technical Analysis
Function: Counter Trend
Mode: Corrective
Structure: Orange Wave 2
Position: Navy Blue Wave 3
Direction Next Higher Degrees: Orange Wave 3
Orange Wave 2 is still active and appears near completion. The wave cancellation invalid level is set at 16044.39.
The weekly chart analysis of the Hang Seng Index highlights a counter-trend in a corrective mode. The focus is on the structure of Orange Wave 2, positioned within Navy Blue Wave 3. This suggests the index is in a corrective phase within the larger upward trend represented by Navy Blue Wave 3.
Details indicate Orange Wave 2 is nearing its end, suggesting the corrective phase is almost over. The index is likely to transition soon into Orange Wave 3, signaling the end of the current consolidation or retracement period and the start of a new impulsive phase with potential upward movement.
The next higher degree direction is identified as Orange Wave 3. After Orange Wave 2 concludes, the index is expected to move into Orange Wave 3, indicating a resumption of the primary upward trend. This transition may present trading opportunities for those looking to capitalize on the new phase.
A crucial aspect of this analysis is the wave cancellation invalid level, set at 16044.39. This level is a key threshold for validating the current wave analysis. If the index falls below this level, the current wave count would be invalidated, requiring a reevaluation of the wave structure and potentially altering the market outlook.
In summary, the Hang Seng Index weekly chart analysis shows the index in a corrective phase within Orange Wave 2, positioned in Navy Blue Wave 3. This phase is nearing completion, suggesting an impending transition to Orange Wave 3. The wave cancel invalid level of 16044.39 is essential for validating the current analysis and serves as a critical threshold to reassess the wave structure if exceeded.
Technical Analyst: Malik Awais
Source: visit Tradinglounge.com and learn From the Experts Join TradingLounge Here
See previous: Dow Jones Index Elliott Wave Analysis
Special Trial Offer - 0.76 Cents a Day for 3 Months! Click here
Access 7 Analysts Over 170 Markets Covered. Chat Room With Support