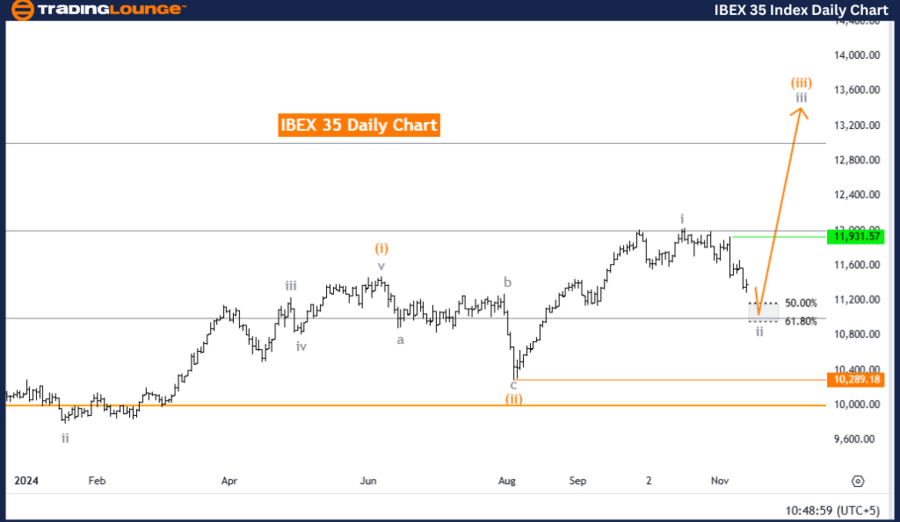
IBEX 35 (Spain) Elliott Wave Analysis - Trading Lounge Daily Chart Analysis
IBEX 35 Elliott Wave Technical Analysis
Function: Counter Trend
Mode: Corrective
Structure: Gray Wave 2
Position: Orange Wave 3
Direction (Next Higher Degrees): Gray Wave 3
Details: Gray wave 1 appears completed; gray wave 2 within orange wave 3 is active.
Wave Cancellation Invalidation Level: 10,289.18
Analysis Overview
The daily IBEX 35 Elliott Wave analysis by Trading Lounge identifies a corrective phase in the Spanish stock index. Currently, gray wave 2 is unfolding within the broader orange wave 3, indicating a counter-trend movement. This development suggests a temporary pullback in the upward trend, marking a period of consolidation or retracement before a potential continuation of the bullish trajectory.
Wave Details
- Gray wave 1 has concluded, allowing gray wave 2 to proceed within the larger orange wave 3 structure.
- Within the Elliott Wave framework, wave 2 typically represents a retracement phase, often characterized by consolidation or price corrections.
- The current corrective phase within orange wave 3 implies the potential for a short-term dip before the next rally, particularly as the higher-degree gray wave 3 gains momentum.
Key Level: Invalidation Threshold
- Invalidation Level: 10,289.18
If the IBEX 35 index falls below this critical level, the ongoing wave structure will be invalidated. Such a breach could indicate a halt or reversal in the trend, necessitating a reassessment of the wave dynamics and the broader trend outlook.

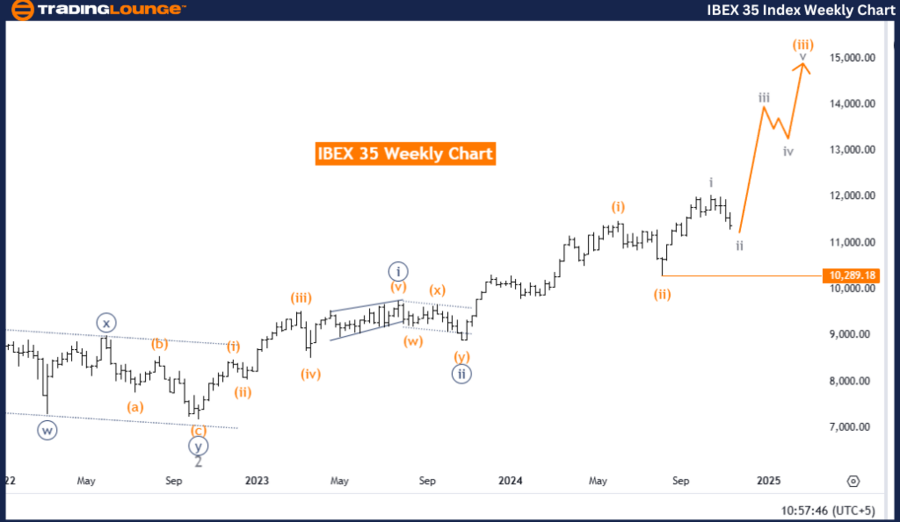
IBEX 35 (Spain) Elliott Wave Analysis - Trading Lounge Weekly Chart Analysis
IBEX 35 Elliott Wave Technical Analysis
Function: Bullish Trend
Mode: Impulsive
Structure: Orange Wave 3
Position: Navy Blue Wave 3
Direction (Next Higher Degrees): Continuation of Orange Wave 3
Details: Orange wave 2 appears complete; orange wave 3 within navy blue wave 3 is active.
Wave Cancellation Invalidation Level: 10,289.18
Analysis Overview
The weekly IBEX 35 Elliott Wave analysis presents a bullish trend supported by an impulsive wave structure. Currently, orange wave 3 is advancing as part of the broader navy blue wave 3, highlighting sustained upward momentum. This phase aligns with the characteristic strength of wave 3 within Elliott Wave theory, reflecting a robust continuation of the index's bullish movement.
Wave Details
- The conclusion of orange wave 2 has paved the way for orange wave 3 to progress.
- Wave 3 is typically a high-momentum phase, marked by significant price increases and strong trend alignment.
- Positioned within navy blue wave 3, the ongoing orange wave 3 reinforces the positive trajectory, suggesting further gains for the IBEX 35 index.
Key Level: Invalidation Threshold
- Invalidation Level: 10,289.18
If the index drops below this level, it would invalidate the current wave structure and potentially signal a pause or reversal in the bullish trend. Monitoring this level is crucial to confirm the wave's strength and the broader upward momentum.
Summary and Recommendations
The weekly analysis indicates a strong bullish outlook for the IBEX 35, with orange wave 3 actively advancing within navy blue wave 3. Traders are advised to monitor the invalidation level at 10,289.18 closely, as a drop below this point could disrupt the current wave structure and trend direction. This threshold serves as a vital checkpoint for confirming the continuation of the bullish trend and identifying potential shifts in market dynamics.
Technical Analyst: Malik Awais
Source: visit Tradinglounge.com and learn From the Experts Join TradingLounge Here
Previous: TASI Index Elliott Wave Technical Analysis
VALUE Offer - Buy 1 Month & Get 3 Months!Click here
Access 7 Analysts Over 200 Markets Covered. Chat Room With Support
