Bovespa Index Elliott Wave Overview - TradingLounge Day Chart
Bovespa Index Day Chart Analysis
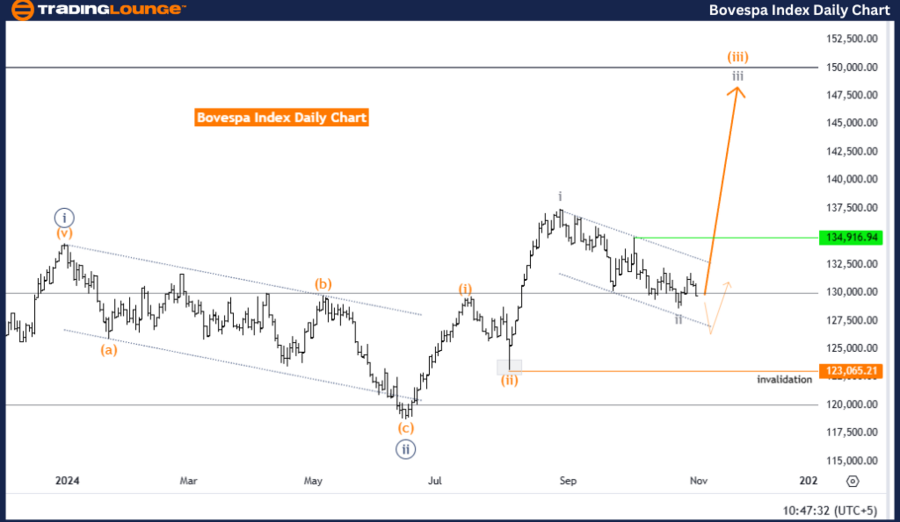
Bovespa Index Elliott Wave Technical Analysis
Trend: Uptrend
Mode: Impulsive
Structure: Gray wave 3
Position: Orange wave 3
Next Higher Degree Direction: Gray wave 3 (initiated)
Details: Gray wave 2 has likely completed; gray wave 3 is in motion
Wave Cancellation Level: 123065.21
The daily Elliott Wave analysis of the Bovespa Index reveals a robust trend structure in impulsive mode, with gray wave 3 actively advancing. Following the likely end of gray wave 2, the Bovespa Index is now positioned in orange wave 3, marking the initiation of a new upward phase aligned with the primary trend.
In this setup, gray wave 3 is an impulsive phase, generally following a corrective wave such as gray wave 2. This structure indicates strong momentum, as impulsive waves typically signify a continuation of the primary trend. The progress in gray wave 3 signals potential for further upward movement, with the wave structure remaining valid above the critical cancellation level.
The wave cancellation level at 123065.21 is pivotal. A drop below this threshold would invalidate the current wave count, suggesting that gray wave 3 may have either stalled or requires re-evaluation. Maintaining levels above this point, however, supports continued upward movement within the primary trend structure.
Summary:
The Bovespa Index is in an advancing phase with gray wave 3 active after the completion of gray wave 2. Positioned in orange wave 3, the current configuration aligns with the broader trend direction, signaling potential gains. The wave cancellation level of 123065.21 is crucial for confirming the trend’s integrity, marking it as an essential validation point in this analysis.
Bovespa Index Elliott Wave Technical Overview - Weekly Chart
Bovespa Index Weekly Chart Analysis
Bovespa Index Technical Analysis Summary
Trend: Uptrend
Mode: Impulsive
Structure: Gray wave 3
Position: Orange wave 3
Next Higher Degree Direction: Gray wave 3 (initiated)
Details: Gray wave 2 appears complete; gray wave 3 now active
Wave Cancellation Level: 123065.21
The weekly Elliott Wave analysis of the Bovespa Index shows a trend-driven, impulsive structure, with gray wave 3 moving forward. Following the end of gray wave 2, the current setup in orange wave 3 signals a significant upward movement within the trend, suggesting the index is in an advanced phase of a larger bullish cycle.
Impulsive waves like gray wave 3 generally reflect strong momentum and sustained movement in the trend direction. With gray wave 2 complete, this phase sets the stage for an ongoing uptrend. Orange wave 3, active within gray wave 3, aligns with the broader trend, signaling potential for continued gains.
The 123065.21 wave cancellation level is essential, acting as a threshold for the current wave count. A move below this point would suggest gray wave 3 might not hold, warranting a re-evaluation of the wave structure. Remaining above supports the current wave count, reinforcing the trend’s strength and the likelihood of continued upward movement.
Summary:
The Bovespa Index aligns strongly with the trend in gray wave 3 after gray wave 2 completion. Positioned in orange wave 3, the setup suggests continued upside potential. The cancellation threshold at 123065.21 is critical to confirm this bullish wave count, marking it as an essential validation point in maintaining the trend direction.
Technical Analyst: Malik Awais
Source: visit Tradinglounge.com and learn From the Experts Join TradingLounge Here
Previous: Euro Stoxx 50 Elliott Wave Technical Analysis
VALUE Offer - Buy 1 Month & Get 3 Months!Click here
Access 7 Analysts Over 200 Markets Covered. Chat Room With Support
