16May

British Pound/ U.S. Dollar (GBPUSD) Forecast: Elliott Wave Analysis Highlights Wave 3 Breakout Opportunity and Trading Setup for Forex Traders

British Pound/ U.S. Dollar (GBPUSD) Elliott Wave Analysis | Trading Lounge Daily Chart

GBPUSD Elliott Wave Technical Outlook

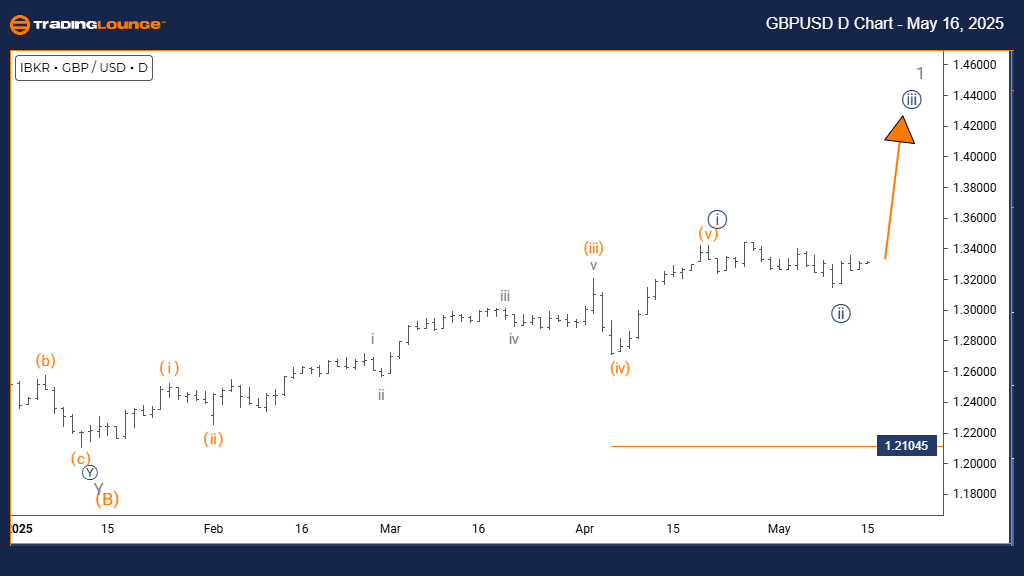
Function: Bullish Market Trend

Wave Mode: Impulsive Wave Pattern

Wave Structure: Developing Navy Blue Wave 3

Current Position: Gray Wave 1 Phase

Next Higher Degree Projection: Navy Blue Wave 3 (In Progress)

Wave Invalidation Level: 1.21045

Market Summary:
The daily GBPUSD chart demonstrates a clearly defined bullish trend, reinforced by impulsive Elliott wave formations. The current pattern shows the development of navy blue wave 3, supported by the prior completion of navy blue wave 2. With gray wave 1 anchoring the new impulse, the chart indicates increasing bullish momentum as wave 3 unfolds—a phase known for delivering strong price advances.

Key insight reveals that navy blue wave 2 is likely finalized, giving way to the active rally in wave 3. As part of this upward Elliott Wave cycle, the trend implies sustained buying interest. Technical validation remains intact unless price dips below the 1.21045 level, which would challenge the current wave count and potentially shift the market narrative.

GBPUSD-Day-forex-cha...


British Pound/ U.S. Dollar (GBPUSD) Elliott Wave Analysis | Trading Lounge 4 Hour Chart

GBPUSD Elliott Wave Technical Outlook

Function: Bullish Price Action

Wave Mode: Impulsive Formation

Wave Structure: Building Orange Wave 1

Current Position: Within Navy Blue Wave 3

Next Higher Degree Projection: Orange Wave 1 (Ongoing)

Wave Invalidation Level: 1.21045

Market Summary:
The GBPUSD 4-hour chart supports a bullish scenario with impulsive wave patterns taking shape. Orange wave 1 is advancing within the broader navy blue wave 3, signaling that the correction from wave 2 has ended and a new bullish leg is underway. This structure typically initiates the start of a strong upward push.

Following the completion of navy blue wave 2, orange wave 1's rise highlights growing momentum. This early-stage bullish wave indicates renewed market interest and possible long-term upside. A drop below 1.21045 would disrupt the current count, signaling the need for structural reevaluation.

Technical Analyst: Malik Awais

Source: Visit Tradinglounge.com and learn from the Experts. Join TradingLounge Here

Previous: USDJPY Elliott Wave Technical Analysis

VALUE Offer - Buy 1 Month & Get 3 Months!Click here

Access 7 Analysts Over 200 Markets Covered. Chat Room With Support

GBPUSD-4h-forex-char...

Related

The Home Depot (HD) Stocks Elliott Wave Technical Analysis: Bearish Trend and Trading Opportunities

The Home Depot (HD) Stocks Elliott Wave Technical Analysis: Bearish Trend and Trading Opportunities

Discover the latest Elliott Wave analysis for The Home Depot (HD), highlighting bearish trends and t...

Read More >
Bovespa Index Elliott Wave Technical Analysis: Examining Current Market Trends, Corrective and Impulse wave Patterns

Bovespa Index Elliott Wave Technical Analysis: Examining Current Market Trends, Corrective and Impulse wave Patterns

This article provides an in-depth Elliott Wave analysis of the Bovespa Index, examining current mark...

Read More >
NVIDIA Corp Stock Analysis: Elliott Wave analysis of NVIDIA Corp (NVDA) Examining Market Structure

NVIDIA Corp Stock Analysis: Elliott Wave analysis of NVIDIA Corp (NVDA) Examining Market Structure

This article provides a thorough Elliott Wave analysis of NVIDIA Corp (NVDA), examining price moveme...

Read More >
Eicher Motors Stock Elliott Wave Analysis: Understand key Wave Counts, Price Predictions, and Technical Chart Insights

Eicher Motors Stock Elliott Wave Analysis: Understand key Wave Counts, Price Predictions, and Technical Chart Insights

Get a comprehensive Elliott Wave analysis of Eicher Motors stock. Understand key wave counts, price ...

Read More >
Salesforce Inc (CRM) Elliott Wave Analysis: Stock Forecast, Trading Strategy, and Key Resistance Levels for Investors

Salesforce Inc (CRM) Elliott Wave Analysis: Stock Forecast, Trading Strategy, and Key Resistance Levels for Investors

This Salesforce (CRM) Elliott Wave Analysis examines the current wave structure, price trends, and f...

Read More >

Buy 1 Month

Get 3 Months!

Special Offer:

Trade Recommendations

Unleash the power of deversified trading with our comprehensive portfolio, covering:

  • Stock Trades
  • Crypto Trades
  • Forex Trades
  • Commodity Trades
Elliott Wave Analysis

Gain a competive edge with expert insights in to:

  • Global Indices
  • US Stocks & ASX Stocks
  • Forex & Crypto
  • Commodities
Top-Notch Trading Tools

Equip yourself with the tools of success:

  • Social Chat
  • Elliott Wave Algorithm
  • Screener
  • TradingLevels
  • Trading Game
7 Elliott Wave Analysts

Stay ahead of the market with daily charts and insightful videos
-Your secret to strategic trading!

JOIN HERE


Welcome to TradingLounge (ASIC A.R.No. 321187), specialists in trades, trading education and technical analysis, covering stocks, indices, commodities, forex and cryptocurrencies.

When you join TradingLounge you have access to everything we offer, including trade tools, educational content and a social platform to chat with like-minded investors.

Read more

@Copyright 2024 by tradinglounge.com

Contact Us

Australian no: 02 4787 6020

International no: +61 (2) 47876020

Pay with:

Find us on