15May

USDJPY Elliott Wave Analysis Highlights Bearish Trend, Impulsive Wave Development, and Trading Strategy for Forex Market Forecast

USDJPY Elliott Wave Analysis – Trading Lounge Day Chart

U.S. Dollar / Japanese Yen (USDJPY) Day Chart Analysis

USDJPY Elliott Wave Technical Analysis

FUNCTION: Counter Trend

MODE: Impulsive

STRUCTURE: Navy Blue Wave 3

POSITION: Gray Wave C

DIRECTION NEXT HIGHER DEGREES: Navy Blue Wave 4

DETAILS:
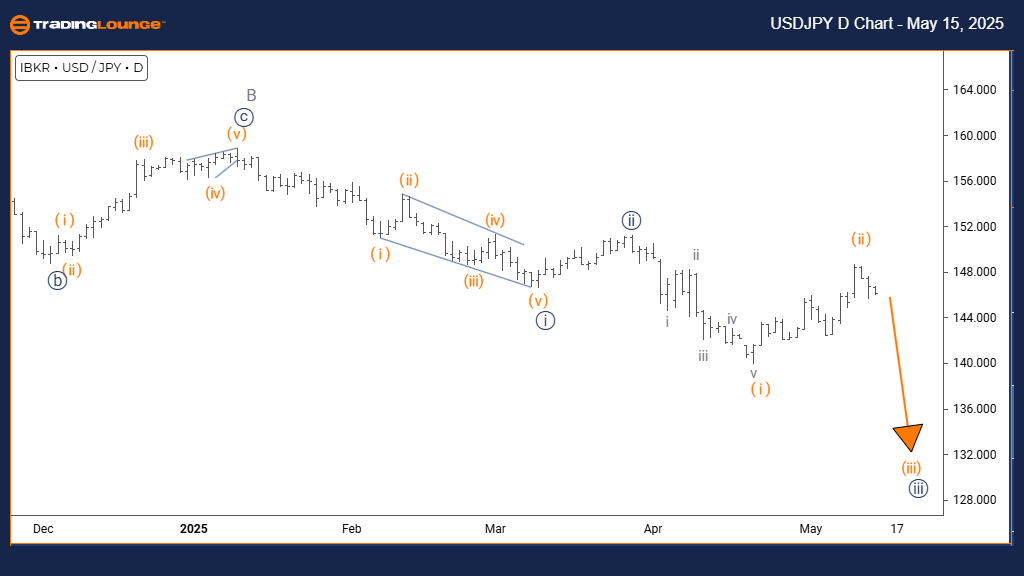
Navy Blue Wave 2 looks to have ended, and the market is now progressing into Navy Blue Wave 3.

The USDJPY daily chart presents a counter-trend scenario supported by impulsive wave behavior within a corrective structure. Based on the updated Elliott Wave count, the pair is currently in Navy Blue Wave 3, nested inside Gray Wave C—signaling a continuation of the corrective move downward.

The analysis confirms the completion of Navy Blue Wave 2 and initiation of Navy Blue Wave 3. This wave phase exhibits impulsive traits, highlighting strong bearish pressure in the USDJPY market structure at this stage.

Looking ahead, Navy Blue Wave 4 is the expected next move, likely serving as a corrective response to the decline in Wave 3. The recent shift from Navy Blue Wave 2 to Wave 3 signals a momentum transition, with more downside risk projected before stabilization.

Given its counter-trend context, this move is better viewed as a phase in a broader correction rather than a long-term bearish reversal. Traders should watch closely for signs of a Wave 3 completion, which may provide short-term buying opportunities with the start of Wave 4. This technical outlook helps identify potential turning points in the USDJPY forecast.

USDJPY-Forex-Day-Cha...


U.S. Dollar / Japanese Yen Elliott Wave Technical Analysis - Tradinglounge 4H Chart

USDJPY Elliott Wave Technical Analysis

FUNCTION: Bearish Trend

MODE: Impulsive

STRUCTURE: Orange Wave 3

POSITION: Navy Blue Wave 3

DIRECTION NEXT LOWER DEGREES: Orange Wave 3 (in progress)

DETAILS:
Orange Wave 2 has likely concluded, and Orange Wave 3 is currently in development.

The 4-hour USDJPY chart illustrates a bearish Elliott Wave setup, signaling strong downside movement through impulsive wave dynamics. Orange Wave 3 is forming within the larger Navy Blue Wave 3, indicating an intensifying bearish phase following the end of Orange Wave 2.

This impulsive wave is typically the strongest within a downward trend, often associated with rapid price declines and heightened volatility. The current wave structure confirms active selling, which reinforces a negative USDJPY trading outlook.

Orange Wave 3’s progression highlights continued downside potential as part of a stronger impulsive move. Traders may interpret this stage as a prime opportunity for short entries while remaining cautious of emerging corrections.

This technical analysis of USDJPY supports strategic planning for short-term trading and risk management. Traders should continue to monitor for clear bearish signals or early exhaustion signs, which can guide position adjustments. This insight helps refine entry points and stop levels during a developing trend.

Technical Analyst: Malik Awais

Source: Visit Tradinglounge.com and learn from the Experts. Join TradingLounge Here

Previous: EURUSD Elliott Wave Technical Analysis

VALUE Offer - Buy 1 Month & Get 3 Months!Click here

Access 7 Analysts Over 200 Markets Covered. Chat Room With Support

USDJPY-Forex-4h-Char...

Related

Gain valuable insights into the current Forex market: British Pound/U.S. Dollar GBPUSD Elliott Wave Technical Analysis

Gain valuable insights into the current Forex market: British Pound/U.S. Dollar GBPUSD Elliott Wave Technical Analysis

This article provides an in-depth GBPUSD Elliott Wave Analysis, focusing on day and 4-hour charts. D...

Read More >
DOTUSD Elliott Wave Technical Analysis: Polkadot Price Prediction, Technical Forecast, Fibonacci Retracement, and Trading Strategies

DOTUSD Elliott Wave Technical Analysis: Polkadot Price Prediction, Technical Forecast, Fibonacci Retracement, and Trading Strategies

DOT/USD with this comprehensive Elliott Wave analysis. Understand the Polkadot corrective wave struc...

Read More >
Best stocks to buy in the Swiss Market Index SMI Elliott Wave Technical Analysis and SMI Market Forecasts

Best stocks to buy in the Swiss Market Index SMI Elliott Wave Technical Analysis and SMI Market Forecasts

Get a detailed Swiss Market Index (SMI) analysis using Elliott Wave Theory. Learn about the latest S...

Read More >
Comprehensive AUD/USD Elliott Wave Analysis: Daily & 4-Hour Charts Reveal Key Trends and Technical Levels for Forex Traders

Comprehensive AUD/USD Elliott Wave Analysis: Daily & 4-Hour Charts Reveal Key Trends and Technical Levels for Forex Traders

This analysis provides an in-depth look at the AUD/USD currency pair through the lens of Elliott Wav...

Read More >
XRP Crypto Price News Today Elliott Wave Technical Analysis: Predicting Price Movements and Strategies

XRP Crypto Price News Today Elliott Wave Technical Analysis: Predicting Price Movements and Strategies

Gain insights into XRP/USD with our Elliott Wave analysis. Learn about XRP price predictions, tradin...

Read More >
Expert NASDAQ Index Elliott Wave Technical Analysis & NDX Analysis: Composite Top Trading Tips and Stock Picks

Expert NASDAQ Index Elliott Wave Technical Analysis & NDX Analysis: Composite Top Trading Tips and Stock Picks

Stay ahead in the market with this comprehensive guide to NASDAQ Composite trading and Elliott Wave ...

Read More >

$1 for 2 Weeks

then $29 a month!

What a Special Offer!

Trade Recommendations

Unleash the power of deversified trading with our comprehensive portfolio, covering 250+ markets:

  • Stock Trades
  • Crypto Trades
  • Forex Trades
  • Commodity Trades
Elliott Wave Analysis

Gain a competitive edge with expert insights and AI-powered Elliott Wave charting into:

  • Global Indices
  • US Stocks & ASX Stocks
  • Forex & Crypto
  • Commodities
Top-Notch Trading Tools

Equip yourself with the tools of success:

  • Real-time Chat rooms
  • Elliott Wave Algorithm
  • Portfolio tools
  • TradingLevels
  • Screener
  • Trading Game
7 Elliott Wave Analysts

Stay ahead of the market with daily charts and insightful videos
Your secret to strategic trading!

JOIN HERE


Welcome to TradingLounge (ASIC A.R.No. 321187), specialists in trades, trading education and technical analysis, covering stocks, indices, commodities, forex and cryptocurrencies.

When you join TradingLounge you have access to everything we offer, including trade tools, educational content and a social platform to chat with like-minded investors.

Read more

@Copyright 2024 by tradinglounge.com

Contact Us

Australian no: 02 4787 6020

International no: +61 (2) 47876020

Pay with:

Find us on