AUDUSD Elliott Wave Analysis – Trading Lounge Daily Chart
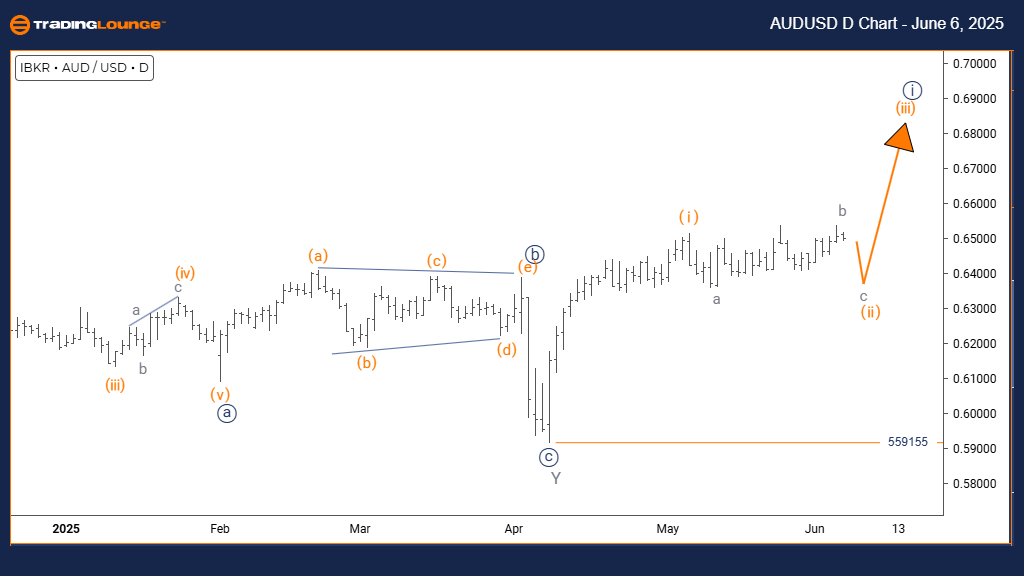
Australian Dollar/U.S. Dollar (AUDUSD) – Daily Chart Analysis
AUDUSD Elliott Wave Technical Analysis
FUNCTION: Counter-Trend
MODE: Corrective
STRUCTURE: Orange Wave 2
POSITION: Navy Blue Wave 1
DIRECTION NEXT HIGHER DEGREES: Orange Wave 3
DETAILS: Completion of orange wave 1 confirmed; orange wave 2 is in progress.
Wave Cancel Invalid Level: 0.559155
The daily chart illustrates a corrective, counter-trend move in AUDUSD within an overall bearish setup. Orange wave 2 is unfolding after the apparent completion of orange wave 1, all nested within navy blue wave 1’s broader decline. This marks a retracement phase, not a new upward trend.
Following the end of orange wave 1, the start of orange wave 2 signals a temporary recovery. However, the broader outlook continues to favor a downward trajectory. The key invalidation point remains at 0.559155—surpassing this level would suggest either a deeper correction or a potential trend shift.
For traders monitoring AUDUSD, this analysis highlights the current corrective stage and implies heightened volatility. As orange wave 2 advances, bearish continuation is expected once this phase concludes. Traders should look for signs marking the transition toward orange wave 3's downward momentum.
This scenario confirms the market's temporary deviation from the main trend while maintaining a broader bearish stance. Traders should remain attentive to technical indicators and apply disciplined risk management. The current movement appears to be a corrective rebound, with bearish continuation likely after wave 2 completes.
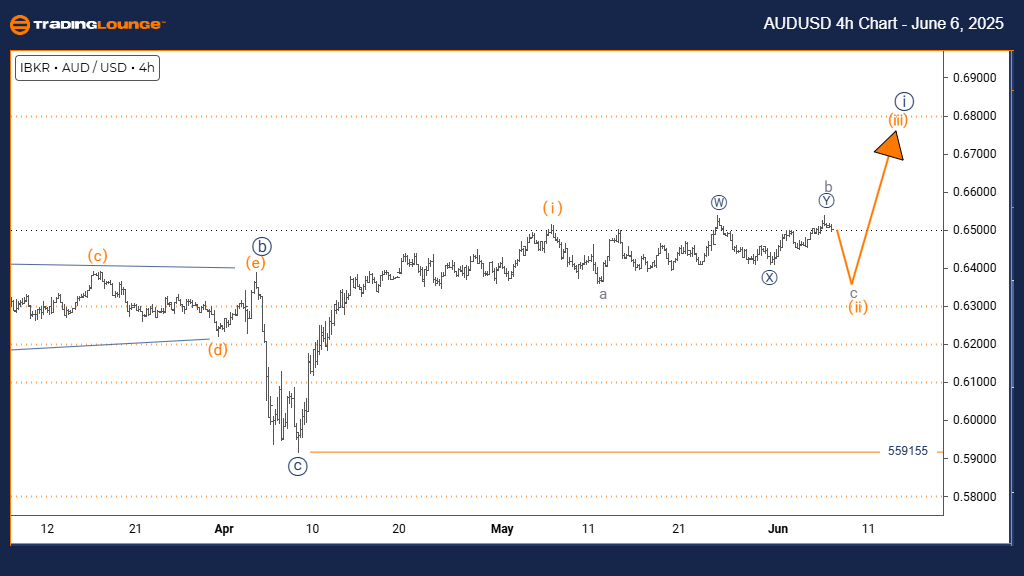
Australian Dollar/U.S. Dollar (AUDUSD) – TradingLounge 4-Hour Chart
AUDUSD Elliott Wave Technical Analysis
FUNCTION: Counter-Trend
MODE: Corrective
STRUCTURE: Gray Wave C
POSITION: Orange Wave 2
DIRECTION NEXT HIGHER DEGREES: Orange Wave 3
DETAILS: Gray wave B has ended; gray wave C is developing downward.
Wave Cancel Invalid Level: 0.559155
The 4-hour chart presents a more granular view of AUDUSD’s ongoing corrective pattern. Gray wave C is unfolding as the concluding segment of orange wave 2, following the completed upward movement of gray wave B. The market now reflects a decline that likely marks the final leg of this retracement.
With gray wave C in progress, the corrective move appears contained within forecasted limits. Once this correction finalizes, the broader trend anticipates a shift back to bearish with the onset of orange wave 3. The 0.559155 level serves as a critical invalidation threshold, where a breach could signal a more complex correction or potential trend change.
This 4-hour perspective helps forex traders identify potential end zones for the corrective wave. As gray wave C progresses, traders can expect modest downside until the broader bearish wave resumes. Monitoring reversal signals will be essential in catching the early stages of orange wave 3’s descent.
This outlook provides traders with actionable insights into the AUDUSD's corrective development and the key technical level guiding trade setups. Caution remains warranted, as misidentifying wave structures can impact trade decisions. The current movement remains part of a corrective pattern, reinforcing a bearish expectation after wave C ends.
Technical Analyst: Malik Awais
Source: Visit Tradinglounge.com and learn from the Experts. Join TradingLounge Here
Previous: GBPUSD Elliott Wave Technical Analysis
VALUE Offer - Buy 1 Month & Get 3 Months!Click here
Access 7 Analysts Over 200 Markets Covered. Chat Room With Support