04Apr

Wheat Commodity Price Forecast: Elliott Wave Setup, Key Support Zones, Bearish Exhaustion, and High-Probability Trade Opportunities

Wheat Elliott Wave Analysis

Wheat Extends Bearish Momentum, Nearing Critical Multi-Year Support Levels

Wheat continued its broader downtrend in February, reinforcing the long-term bearish structure that has persisted since March 2022. The price action remains under pressure, increasing the likelihood of a break below the July 2024 low and testing price territory not seen since 2020.

Despite ongoing weakness, the downward momentum could be nearing completion, with Elliott Wave patterns suggesting an approaching end to the bearish cycle. This scenario opens the door for a corrective rally to unfold in the near future.

Once the downward sequence concludes, wheat prices are expected to initiate a multi-month bullish retracement, recovering part of the extended downtrend.

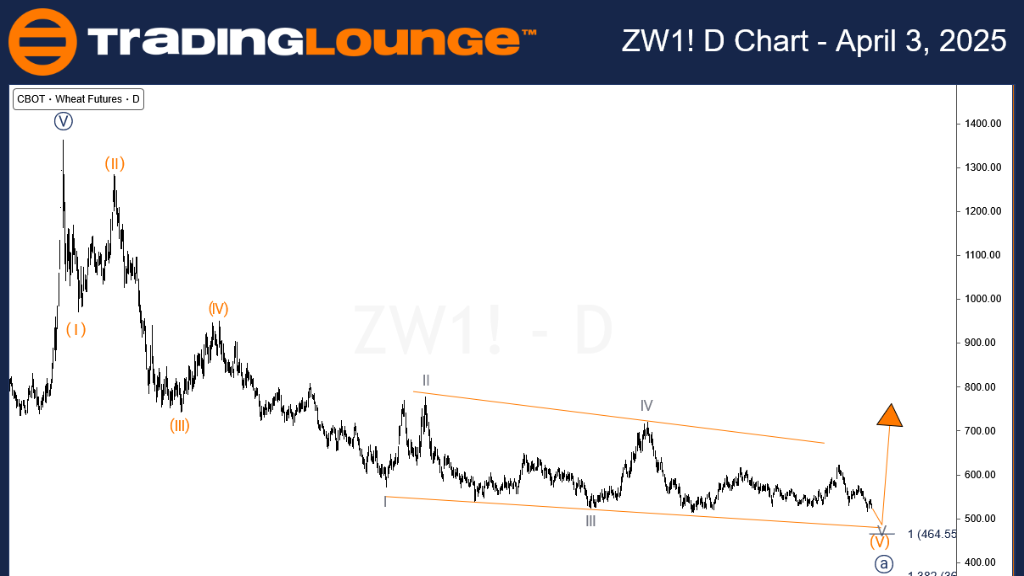
Daily Chart Analysis: Ending Diagonal Structure Approaching Final Phase

In the daily chart analysis, wheat’s decline since March 2022 has followed a clear impulsive pattern, where wave ((A)) has evolved through a five-wave move. The final component, wave (V), is forming an ending diagonal—often indicative of a terminal price structure and a possible trend reversal.

Wave V of (V), which started in May 2024, now appears to be in its final phase. As is typical in diagonal patterns, a final drop is likely before the broader correction begins. The $500 support level represents a key price zone to watch for a potential low.

If price action confirms structural support around this area, traders can look for signs of a trend reversal and a significant corrective bounce to follow.

Wheat-Commodity-Day-...


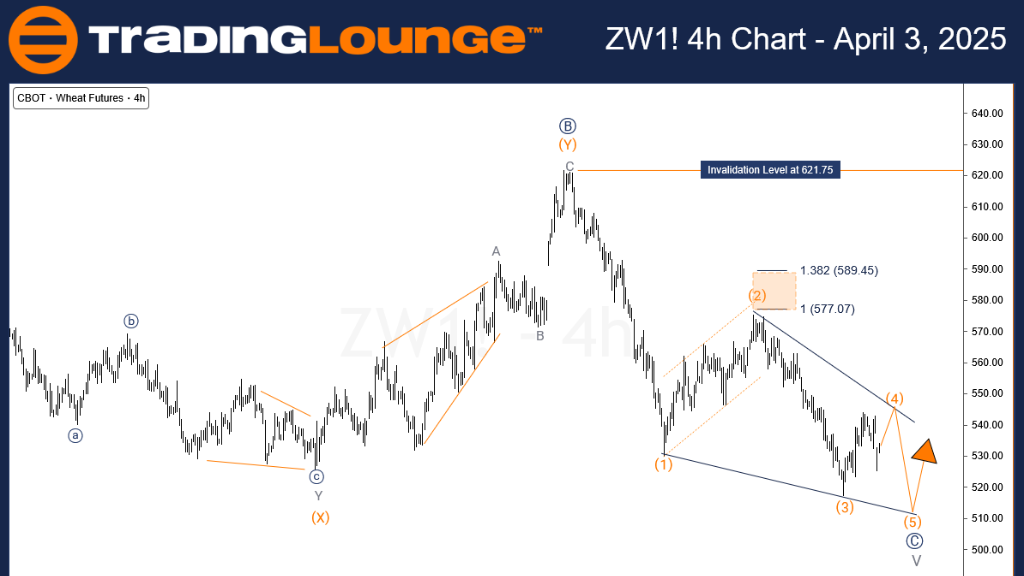
H4 Chart Analysis: Completion of Final Wave V Underway

In the H4 timeframe, wave V of (V) of ((A)) is advancing within an ending diagonal formation. At present, wave (4) of ((C)) of V is unfolding, possibly needing one more short-term push higher before wave (5) drives the market lower. A successful diagonal completion would likely push wheat prices below $500 before any meaningful corrective movement begins.

If, however, the wave structure fails to hold and bearish momentum accelerates, a deeper move under $500 could unfold before bulls step in. Traders should wait for clear structural confirmation before entering long positions or adjusting trade setups.

Technical Analyst: Sanmi Adeagbo

Source: Visit Tradinglounge.com and learn from the Experts Join TradingLounge Here 

See Previous: Corn Elliott Wave Technical Analysis

VALUE Offer - Buy 1 Month & Get 3 Months!Click here

Access 7 Analysts Over 200 Markets Covered. Chat Room With Support

Wheat-Commodity-4h-C...

Related

Bitcoin/U.S. dollar(BTCUSD) Elliott Wave Technical Analysis 31 October 23

Bitcoin/U.S. dollar(BTCUSD) Elliott Wave Technical Analysis 31 October 23

Bitcoin/U.S. dollar(BTCUSD) Elliott Wave Technical Analysis on 31 October 23 with BTCUSD Analysis Da...

Read More >
Cardano Crypto Price News Today: Our Detailed Elliott Wave Technical Analysis ADAUSD Provides Detailed Insights

Cardano Crypto Price News Today: Our Detailed Elliott Wave Technical Analysis ADAUSD Provides Detailed Insights

Our detailed Elliott Wave Analysis for Cardano (ADAUSD) provides comprehensive insights into price p...

Read More >
Exxon Mobil Inc. (XOM) Elliott Wave Analysis Shows Bullish Trend Continuation With Developing Impulse Wave For Strong Stock Forecast

Exxon Mobil Inc. (XOM) Elliott Wave Analysis Shows Bullish Trend Continuation With Developing Impulse Wave For Strong Stock Forecast

Exxon Mobil (XOM) is in a bullish Elliott wave structure, with wave {iii} developing. Chart patterns...

Read More >
Elliott Wave Technical Analysis for Visa Inc.(V) Stocks Predictions, Stock Trends, and Technical Insights

Elliott Wave Technical Analysis for Visa Inc.(V) Stocks Predictions, Stock Trends, and Technical Insights

This article provides an in-depth Elliott Wave analysis of Visa Inc., examining the technical aspect...

Read More >
TASI Index Elliott Wave Technical Analysis: Detailing its Current and Projected Market Movements.

TASI Index Elliott Wave Technical Analysis: Detailing its Current and Projected Market Movements.

This article provides an in-depth Elliott Wave analysis of the TASI Index, detailing its current and...

Read More >

$1 for 2 Weeks

then $29 a month!

What a Special Offer!

Trade Recommendations

Unleash the power of deversified trading with our comprehensive portfolio, covering 250+ markets:

  • Stock Trades
  • Crypto Trades
  • Forex Trades
  • Commodity Trades
Elliott Wave Analysis

Gain a competitive edge with expert insights and AI-powered Elliott Wave charting into:

  • Global Indices
  • US Stocks & ASX Stocks
  • Forex & Crypto
  • Commodities
Top-Notch Trading Tools

Equip yourself with the tools of success:

  • Real-time Chat rooms
  • Elliott Wave Algorithm
  • Portfolio tools
  • TradingLevels
  • Screener
  • Trading Game
7 Elliott Wave Analysts

Stay ahead of the market with daily charts and insightful videos
Your secret to strategic trading!

JOIN HERE


Welcome to TradingLounge (ASIC A.R.No. 321187), specialists in trades, trading education and technical analysis, covering stocks, indices, commodities, forex and cryptocurrencies.

When you join TradingLounge you have access to everything we offer, including trade tools, educational content and a social platform to chat with like-minded investors.

Read more

@Copyright 2024 by tradinglounge.com

Contact Us

Australian no: 02 4787 6020

International no: +61 (2) 47876020

Pay with:

Find us on