15Apr

Gold Commodity Price Forecast Using Elliott Wave: 2024 Bullish Trend Points to $3500 Target After Pullback – When to Buy

Gold Elliott Wave Analysis – Bullish Momentum to Continue Toward $3200–$3500

Gold prices are hovering near fresh record highs as ongoing global uncertainty—particularly trade tensions between the U.S. and key partners—continues to drive demand for the safe-haven asset. From an Elliott Wave analysis perspective, this sustained rally was forecasted to resume its long-term bullish trend following the completion of a 2-year corrective phase in October 2022. Current projections place the next major upside targets between $3200 and $3500.

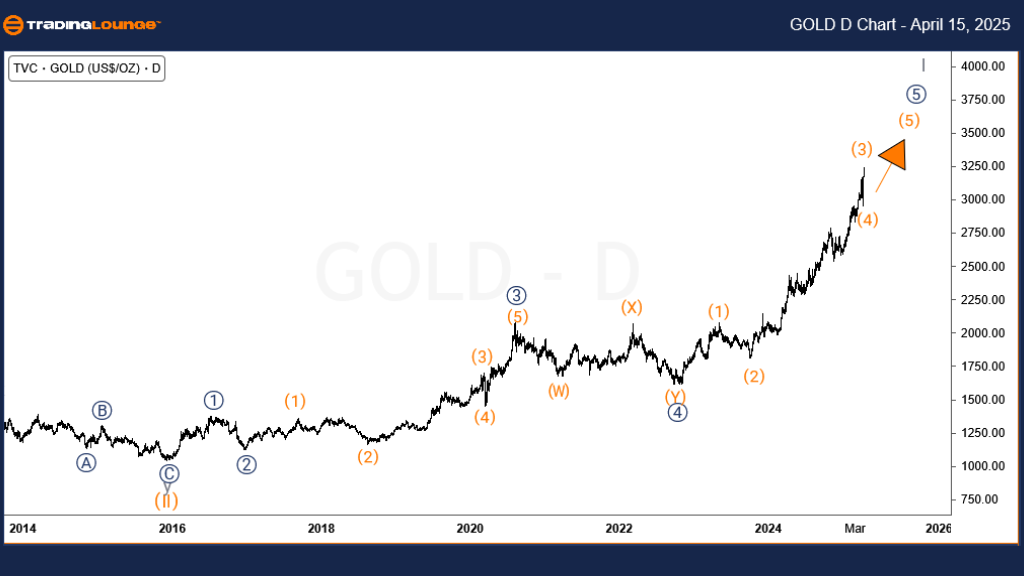
Gold Daily Chart Analysis – Elliott Wave Bull Market Structure

Gold remains in a powerful long-term uptrend. The current bullish wave structure follows a significant 2-year corrective pullback from the September 2011 peak, which previously marked the all-time high. After breaking above that high in July 2020, gold has consistently printed new highs on the monthly, weekly, and daily timeframes.

According to Elliott Wave theory, the supercycle wave (II) ended in December 2015, following wave (I)’s peak in September 2011. Since then, wave (III) has advanced sharply. Currently, wave ((5)) of I of (III) is unfolding. The daily chart indicates that wave (4) of ((5)) of I has completed, and wave (5) of ((5)) is underway. However, this final wave of the sequence has yet to conclude, suggesting further upside before a major correction in wave II sets in.

Gold-Commodity-day-C...


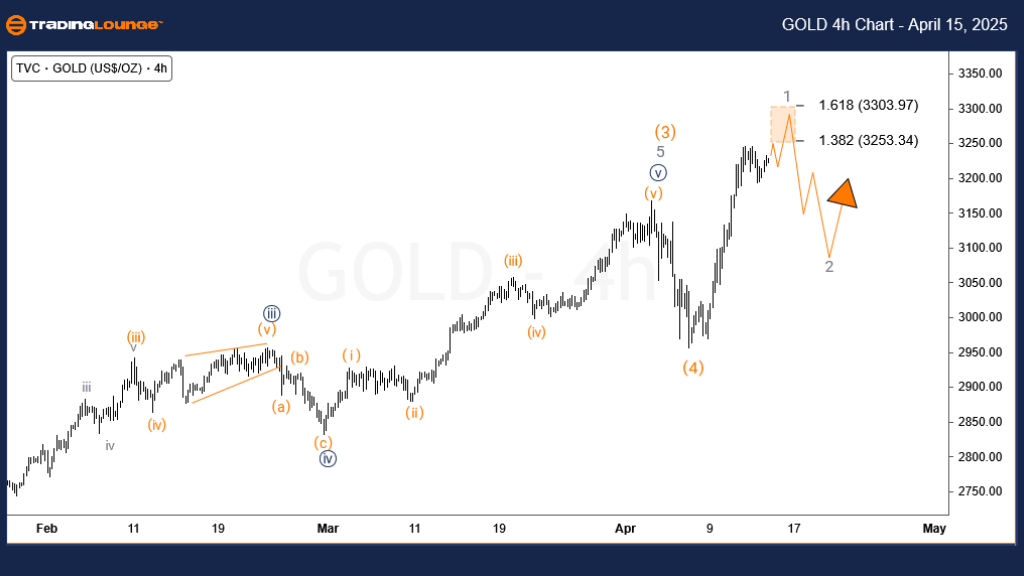
Gold 4-Hour Chart Analysis – Final Impulse Before Pullback

The 4-hour chart highlights the development of wave ((5)), which began from the April 2024 low. This impulse wave structure is now in its terminal phase and could either represent the end of wave (5) of ((5)) of I or the completion of wave 1 of a larger wave (5).

Regardless of the exact structure, the wave count implies that a short-term corrective pullback may soon emerge. Traders are advised to remain patient, monitor for completed pullbacks, and look for buying opportunities aligned with the broader bullish trend.

Technical Analyst: Sanmi Adeagbo

Source: Visit Tradinglounge.com and learn from the Experts Join TradingLounge Here 

See Previous: Wheat Elliott Wave Technical Analysis

VALUE Offer - Buy 1 Month & Get 3 Months!Click here

Access 7 Analysts Over 200 Markets Covered. Chat Room With Support

Gold-Commodity-4h-Ch...

Related

U.S. Dollar / Japanese Yen Forex Elliott Wave Technical Analysis: USDJPY Forecast and Effective Trading Strategies

U.S. Dollar / Japanese Yen Forex Elliott Wave Technical Analysis: USDJPY Forecast and Effective Trading Strategies

The USDJPY Elliott Wave analysis provides an in-depth look at the current corrective phase, highligh...

Read More >
Insurance Australia Group (ASX:IAG) Elliott Wave Forecast: Chart Analysis, Price Targets, Resistance Levels & Trading Strategy

Insurance Australia Group (ASX:IAG) Elliott Wave Forecast: Chart Analysis, Price Targets, Resistance Levels & Trading Strategy

ASX: IAG shows signs of completing wave B-grey in an Expanded Flat. Expect resistance before a possi...

Read More >
DAX Elliott Wave Analysis: Explore Germany's Stock Market Trends, Bullish Forecasts, and Trading Strategies for 2025

DAX Elliott Wave Analysis: Explore Germany's Stock Market Trends, Bullish Forecasts, and Trading Strategies for 2025

DAX (Germany) Elliott Wave Analysis, highlighting key trends and forecasts for 2025. This analysis f...

Read More >
Caterpillar Inc. Stocks Elliott Wave Analysis: Detailed Technical Analysis Highlights Potential Targets of $400 and $500 for CAT

Caterpillar Inc. Stocks Elliott Wave Analysis: Detailed Technical Analysis Highlights Potential Targets of $400 and $500 for CAT

This analysis provides a comprehensive look at Caterpillar Inc. (CAT) stock using Elliott Wave theor...

Read More >
LINKUSD Elliott Wave Analysis: Chainlink Price Forecast, Fibonacci Levels, Support and Resistance Insights for Crypto Traders

LINKUSD Elliott Wave Analysis: Chainlink Price Forecast, Fibonacci Levels, Support and Resistance Insights for Crypto Traders

LINK/USD Elliott Wave analysis to understand Chainlink's price movements and potential trends. E...

Read More >

$1 for 2 Weeks

then $29 a month!

What a Special Offer!

Trade Recommendations

Unleash the power of deversified trading with our comprehensive portfolio, covering 250+ markets:

  • Stock Trades
  • Crypto Trades
  • Forex Trades
  • Commodity Trades
Elliott Wave Analysis

Gain a competitive edge with expert insights and AI-powered Elliott Wave charting into:

  • Global Indices
  • US Stocks & ASX Stocks
  • Forex & Crypto
  • Commodities
Top-Notch Trading Tools

Equip yourself with the tools of success:

  • Real-time Chat rooms
  • Elliott Wave Algorithm
  • Portfolio tools
  • TradingLevels
  • Screener
  • Trading Game
7 Elliott Wave Analysts

Stay ahead of the market with daily charts and insightful videos
Your secret to strategic trading!

JOIN HERE


Welcome to TradingLounge (ASIC A.R.No. 321187), specialists in trades, trading education and technical analysis, covering stocks, indices, commodities, forex and cryptocurrencies.

When you join TradingLounge you have access to everything we offer, including trade tools, educational content and a social platform to chat with like-minded investors.

Read more

@Copyright 2024 by tradinglounge.com

Contact Us

Australian no: 02 4787 6020

International no: +61 (2) 47876020

Pay with:

Find us on