GBPUSD Elliott Wave Analysis - Trading Lounge Daily Chart
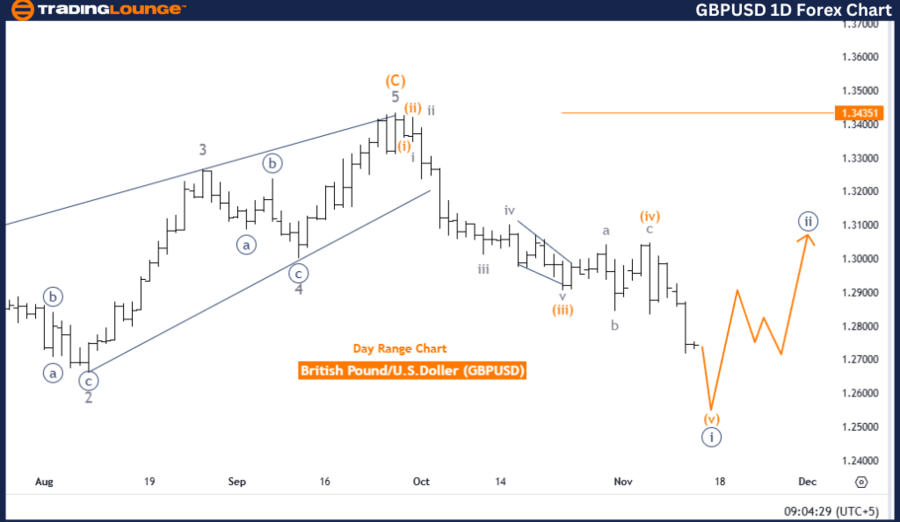
British Pound/U.S. Dollar (GBPUSD) Daily Chart
GBPUSD Elliott Wave Technical Analysis
Function: Bearish Trend
Mode: Impulsive
Structure: Navy Blue Wave 1
Position: Gray Wave 1
Direction Next Higher Degrees: Navy Blue Wave 2
Details: Navy Blue Wave 1 remains active.
Wave Cancel Invalid Level: 1.34351
The daily Elliott Wave analysis for GBPUSD by Trading Lounge emphasizes a bearish trend. This movement is part of an impulsive wave structure, with navy blue wave 1 in progress. This ongoing wave highlights sustained downward momentum within the broader bearish trend.
Currently positioned in gray wave 1, this phase signals further potential price declines as the impulsive wave continues to unfold. The ongoing navy blue wave 1 indicates a continuation of bearish pressure, aligning with the overall downtrend framework.
The impulsive wave structure suggests strong, directional price movements, reinforcing expectations for additional downside. The analysis identifies 1.34351 as the invalidation level—a key threshold that, if breached, would nullify the current wave count and indicate a possible corrective phase or trend reversal. Such an event would require a reassessment of the current Elliott Wave analysis.
Summary
The analysis remains bearish for GBPUSD as navy blue wave 1 progresses within the impulsive structure of gray wave 1. Traders should monitor price levels near the invalidation point at 1.34351. A break above this threshold could indicate a trend reversal or a significant shift in wave structure, challenging the bearish outlook.

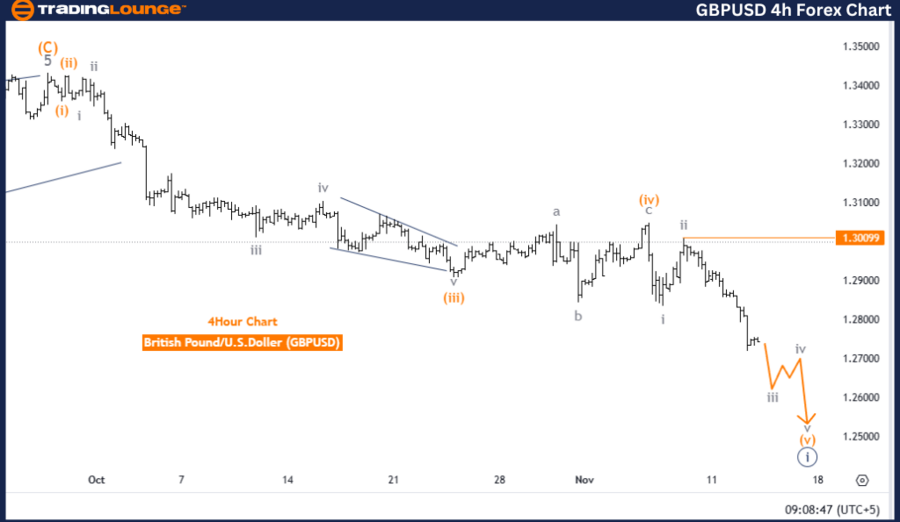
British Pound/U.S. Dollar (GBPUSD) 4-Hour Chart
GBPUSD Elliott Wave Technical Analysis
Function: Bearish Trend
Mode: Impulsive
Structure: Orange Wave 5
Position: Navy Blue Wave 1
Direction Next Higher Degrees: Navy Blue Wave 2
Details: Orange Wave 4 appears completed. Orange Wave 5 of Navy Blue Wave 1 is active.
Wave Cancel Invalid Level: 1.30099
The 4-hour GBPUSD Elliott Wave analysis from Trading Lounge continues to identify a bearish trend, driven by an impulsive wave structure. Currently, orange wave 5 is developing within the broader navy blue wave 1, signaling persistent downside momentum.
Following the apparent completion of orange wave 4, orange wave 5 is now active. In Elliott Wave terms, wave 5 typically represents the final phase of an impulsive trend, reinforcing bearish momentum and increasing the likelihood of further declines.
The analysis marks 1.30099 as the invalidation level for the current wave structure. A price movement above this threshold would nullify the wave count, signaling either a trend reversal or the onset of a corrective phase. This level serves as a key reference point for validating or challenging the bearish analysis.
Summary
The 4-hour chart supports a bearish outlook, with orange wave 5 unfolding within navy blue wave 1. Traders are advised to monitor price action near the invalidation level at 1.30099. A breach of this level could signify a reversal or a significant structural change, requiring an update to the current Elliott Wave analysis.
Technical Analyst: Malik Awais
Source: visit Tradinglounge.com and learn From the Experts Join TradingLounge Here
Previous: USDCAD Elliott Wave Technical Analysis
VALUE Offer - Buy 1 Month & Get 3 Months!Click here
Access 7 Analysts Over 200 Markets Covered. Chat Room With Support
