21May

Wheat Commodity Elliott Wave Technical Analysis Indicates the End of a Long-term Bearish Cycle and an Upcoming Bullish Correction

Wheat Elliott Wave Analysis – Trading Lounge

Wheat is approaching the terminal phase of its extended bearish trend, which started after the price peaked above $1360 in March 2022. Since that high, a well-defined Elliott Wave impulse pattern has unfolded and is now nearing its end. A bullish reversal or corrective bounce may soon begin, signaling the potential start of a multi-month recovery phase.


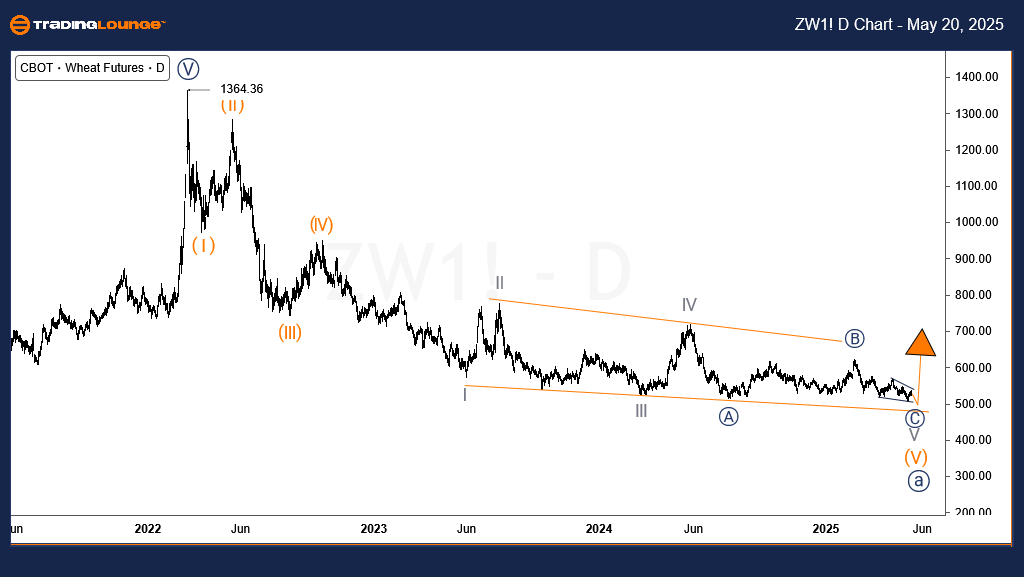
Wheat Daily Chart Analysis

The daily chart outlines a continuous bearish impulse structure stemming from the March 2022 high. Waves (I) through (IV) were completed by October 2022. Following that, wave (V) has been developing as a diagonal pattern, extending for more than two and a half years. This suggests wave (V) may be nearing completion, prompting long-term bearish positions to be reconsidered or closed, as a trend reversal may be imminent.

Wheat-Commodity-day-...


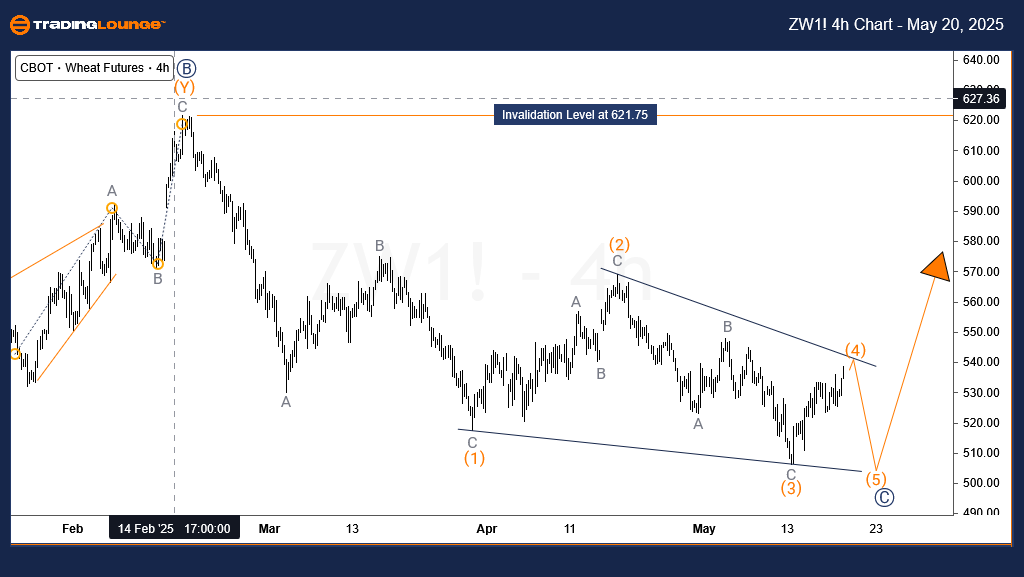
Wheat H4 Chart Analysis

On the 4-hour chart, focus remains on wave V within the broader diagonal formation of wave (V). Wave V has followed a three-part Elliott Wave sequence. Wave ((A)), an impulsive move, developed between May and July 2024. Subsequently, wave ((B)) formed a double zigzag correction from July 2024 to February 2025. Currently, wave ((C)) is unfolding as a diagonal and is in sub-wave (4) of ((C)). One final decline, potentially targeting the $500 level or slightly under, is anticipated to complete wave ((C)) of V. This move would mark the conclusion of the bearish cycle initiated in March 2022 and could pave the way for a sustained upward correction over the coming months.

Technical Analyst: Sanmi Adeagbo

Source: Visit Tradinglounge.com and learn from the Experts. Join TradingLounge Here 

See Previous: Silver Elliott Wave Technical Analysis

VALUE Offer - Buy 1 Month & Get 3 Months!Click here

Access 7 Analysts Over 200 Markets Covered. Chat Room With Support

Wheat-Commodity-4h-c...


photo_61522661820911...

Related

S&P 500 Elliott Wave Technical Analysis: Forecasts, Trading Strategies, and Market Trends for Successful Stock Trading

S&P 500 Elliott Wave Technical Analysis: Forecasts, Trading Strategies, and Market Trends for Successful Stock Trading

S&P 500 Elliott Wave Analysis including day and weekly charts. Understand wave patterns like impulse...

Read More >
FTSE 100 (UK) Elliott Wave Technical Analysis: Invest in UKX Stocks with Expert Tips, Market Forecasts, and Daily Updates

FTSE 100 (UK) Elliott Wave Technical Analysis: Invest in UKX Stocks with Expert Tips, Market Forecasts, and Daily Updates

This guide covers insights into UKX analysis, investment tips, and trading strategies. Discover the ...

Read More >
NASDAQ Elliott Wave Analysis: SPX, JPM, AAPL, AMZN, NVDA, TSLA, GOOGL, META, NFLX, MSFT 2024 Forecast

NASDAQ Elliott Wave Analysis: SPX, JPM, AAPL, AMZN, NVDA, TSLA, GOOGL, META, NFLX, MSFT 2024 Forecast

This article offers a detailed Elliott Wave analysis of the NASDAQ stock market, focusing on key tec...

Read More >
ARK Fintech Innovation ETF – ARKF Elliott Wave Analysis: Price Forecast, Trends, and Key Trading Strategy Insights

ARK Fintech Innovation ETF – ARKF Elliott Wave Analysis: Price Forecast, Trends, and Key Trading Strategy Insights

ARKF (ARK Fintech Innovation ETF), focusing on its current market position using Elliott Wave Theory...

Read More >
Abbie Inc US Stock Set for Drop: ABBV Elliott Wave Predicts Sharp ZigZag Correction Toward $165 with Prime Trade Opportunities

Abbie Inc US Stock Set for Drop: ABBV Elliott Wave Predicts Sharp ZigZag Correction Toward $165 with Prime Trade Opportunities

ABBV stock is forming a ZigZag corrective pattern in Elliott Wave structure, signaling a strong bear...

Read More >
Dogecoin (DOGEUSD) Elliott Wave Technical Analysis – Price Prediction, Trading Strategy, Support & Resistance Levels

Dogecoin (DOGEUSD) Elliott Wave Technical Analysis – Price Prediction, Trading Strategy, Support & Resistance Levels

Dogecoin (DOGEUSD) Elliott Wave analysis provides a detailed look at the current price trends, marke...

Read More >

$1 for 2 Weeks

then $29 a month!

What a Special Offer!

Trade Recommendations

Unleash the power of deversified trading with our comprehensive portfolio, covering 250+ markets:

  • Stock Trades
  • Crypto Trades
  • Forex Trades
  • Commodity Trades
Elliott Wave Analysis

Gain a competitive edge with expert insights and AI-powered Elliott Wave charting into:

  • Global Indices
  • US Stocks & ASX Stocks
  • Forex & Crypto
  • Commodities
Top-Notch Trading Tools

Equip yourself with the tools of success:

  • Real-time Chat rooms
  • Elliott Wave Algorithm
  • Portfolio tools
  • TradingLevels
  • Screener
  • Trading Game
7 Elliott Wave Analysts

Stay ahead of the market with daily charts and insightful videos
Your secret to strategic trading!

JOIN HERE


Welcome to TradingLounge (ASIC A.R.No. 321187), specialists in trades, trading education and technical analysis, covering stocks, indices, commodities, forex and cryptocurrencies.

When you join TradingLounge you have access to everything we offer, including trade tools, educational content and a social platform to chat with like-minded investors.

Read more

@Copyright 2024 by tradinglounge.com

Contact Us

Australian no: 02 4787 6020

International no: +61 (2) 47876020

Pay with:

Find us on