Elliott Wave Analysis: Navigating the ETHUSD Uptrend
In the fascinating world of cryptocurrency trading, Ethereum (ETHUSD) stands out with its dynamic market movements. A powerful tool to decode these movements is the Elliott Wave Analysis, a method that offers insights into market trends and helps traders make informed decisions. This guide dives into the daily and 4-hour chart analyses of ETHUSD, providing a strategic approach to trading Ethereum using Elliott Wave principles.
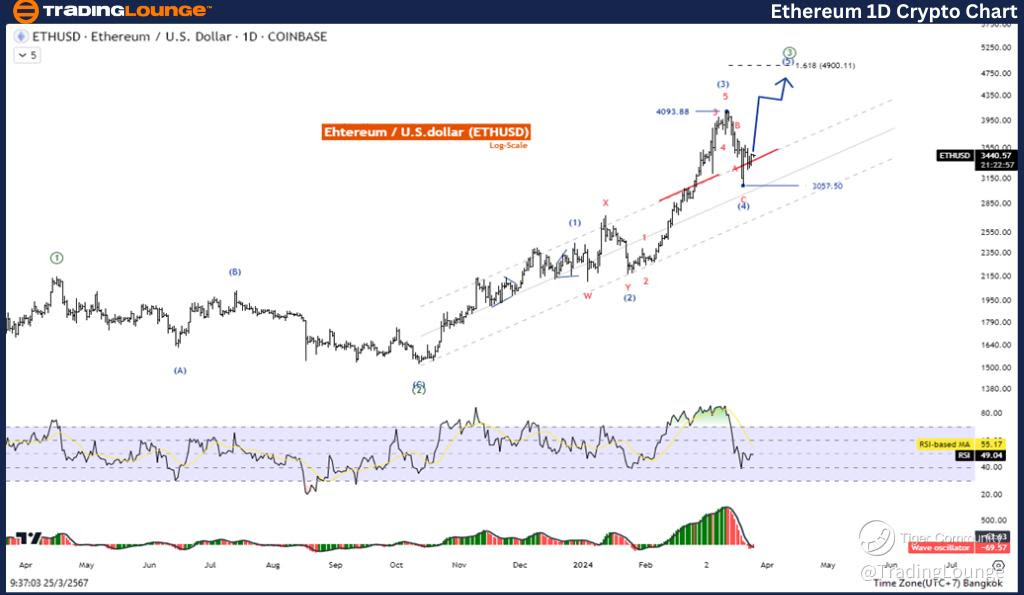
TradingLounge Daily Chart Insights: ETHUSD's Bullish Impulse Wave
Ethereum/ U.S. dollar(ETHUSD) Daily Chart Analysis
ETHUSD Elliott Wave Technical Analysis
Elliott Wave Technical Overview:
- Function: Trend Following
- Mode: Motive
- Structure: Impulse
- Current Position: Wave (5)
- Next Direction: Towards wave ((3))
Analyzing the Waves:
Ethereum's price action on the daily chart presents a textbook example of an Impulse pattern, signifying a strong uptrend. This analysis identifies Ethereum's journey through the waves, currently placing it at the start of Wave (5) after completing the fourth wave's correction. This positioning suggests an impending price increase, offering traders an opportunity to capitalize on the fifth wave's uptrend.
Trading Ethereum: A Strategy for the Impulse Wave
Ethereum's market behavior follows an Impulse pattern, a clear indication of its uptrend momentum. With the completion of the third wave, the market is rebounding from the fourth wave's correction, setting the stage for a rise in Wave (5). Traders should monitor this phase closely, as it presents lucrative opportunities to trade Ethereum's uptrend.
Technical Indicators:
- Uptrend Confirmation: Price positioning above the MA200 signals a sustained uptrend.
- Momentum Indicator: A bullish wave oscillator further confirms the positive momentum.
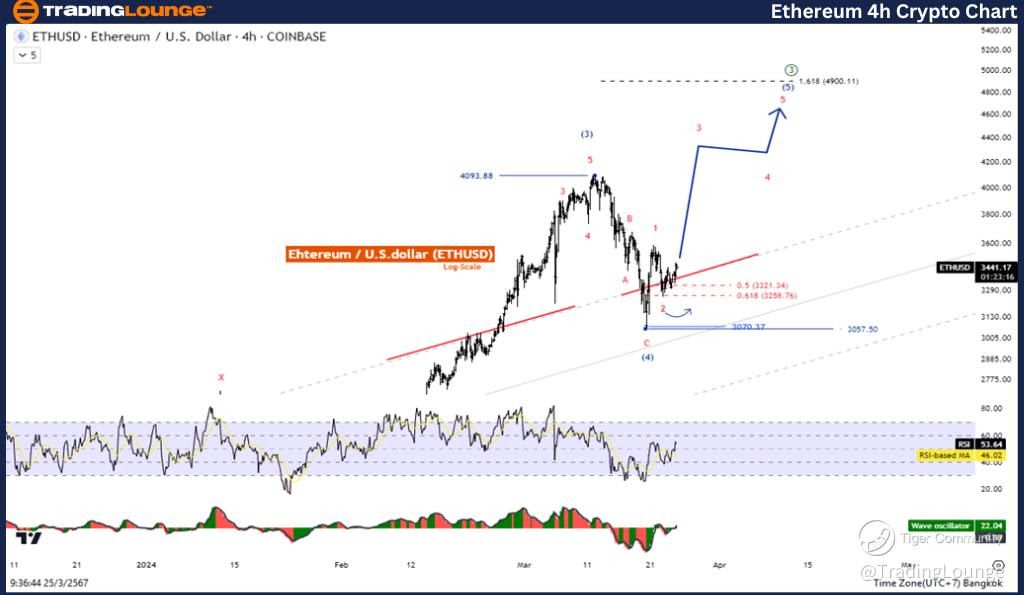
ETHUSD 4-Hour Chart Analysis: Detailed View of Ethereum's Uptrend
The 4-hour chart echoes the daily analysis, reinforcing the bullish outlook for Ethereum. It provides a closer look at the price movements and supports the trading strategy outlined above.
Ethereum/ U.S. dollar(ETHUSD) 4H Chart Analysis
Elliott Wave Technical Analysis of ETHUSD
Elliott Wave Technical Overview:
- Function: Trend Following
- Mode: Motive
- Structure: Impulse
- Current Position: Wave (5)
- Next Direction: Towards wave ((3))
Key Insights and Trading Strategy:
The 4-hour chart analysis aligns with the daily chart's findings, offering a granular view of Ethereum's bullish trend. By focusing on the Impulse pattern and anticipating the climb in Wave (5), traders have a clear roadmap for navigating the ETHUSD market.
Technical Indicators:
- The sustained position above the MA200 and bullish momentum, as indicated by the wave oscillator, underline the uptrend's strength.
Conclusion: Mastering ETHUSD Trading with Elliott Wave Analysis
Elliott Wave Analysis presents a structured and insightful approach to trading Ethereum. By understanding the wave patterns and utilizing technical indicators, traders can make strategic decisions to leverage Ethereum's uptrend. Whether analyzing the daily or 4-hour charts, the Impulse pattern offers a clear signal for potential growth in ETHUSD, making it an essential tool for any trader's arsenal.
Navigating Ethereum's Market Waves: A Strategic Outlook
Ethereum's Elliott Wave Analysis not only demystifies its market movements but also equips traders with a comprehensive strategy for exploiting the uptrend. By meticulously following the wave patterns and aligning with technical indicators, traders can enhance their market positioning and capitalize on Ethereum's dynamic price action.
Technical Analyst: Kittiampon Somboonsod, CEWA
Source: visit Tradinglounge.com and learn From the Experts Join TradingLounge Here
See Previous: AAVE/ U.S. dollar(AAVEUSD)
TradingLounge Once Off SPECIAL DEAL: Here > 1 month Get 3 months.