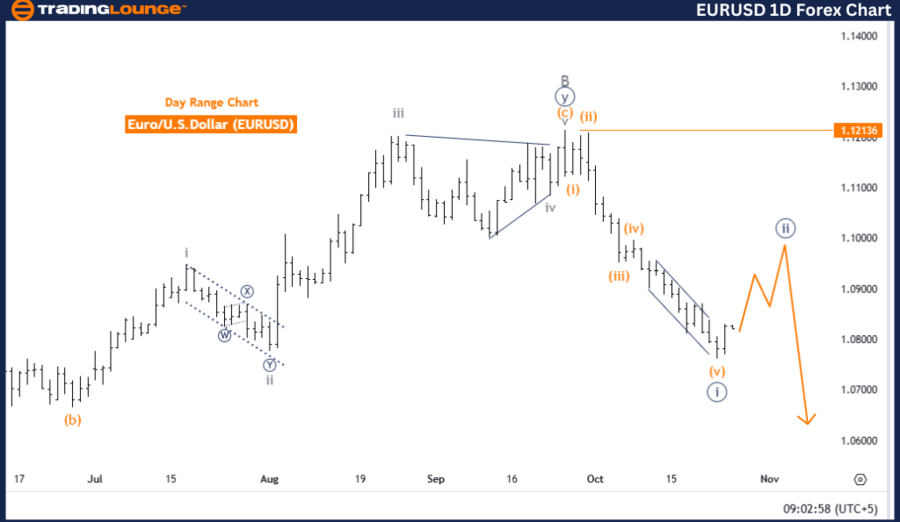
EURUSD Elliott Wave Analysis - Trading Lounge Day Chart
Euro/U.S. Dollar (EURUSD) - Day Chart Analysis
Elliott Wave Technical Analysis
Function: Counter Trend
Mode: Corrective
Wave Structure: Navy Blue Wave 2
Position: Gray Wave C
Next Lower Degree Direction: Navy Blue Wave 3
Details: Navy blue wave 1 has likely concluded; navy blue wave 2 is now active.
Wave Cancel Level: 1.12136
EURUSD Day Chart Analysis Summary
The Elliott Wave analysis of the EURUSD Day Chart points to a counter-trend in a corrective structure. Focus is currently on navy blue wave 2, which began after the completion of navy blue wave 1. This stage signifies a market retracement phase, with price movement against the primary trend.
Currently, EURUSD is positioned in gray wave C, part of the corrective navy blue wave 2. This setup suggests that the retracement may soon conclude, after which navy blue wave 3 is anticipated to begin, likely resuming the main trend, contingent on market dynamics.
The completion of navy blue wave 1 highlights an impulsive movement, positioning the market in a pullback phase via navy blue wave 2. In Elliott Wave theory, markets alternate between impulsive and corrective phases, with wave 2 functioning as a correction after an initial impulse wave.
The wave cancellation level is established at 1.12136. Should prices move below this level, the current wave count will be invalidated, prompting a revised structural analysis.
Summary of EURUSD Day Chart Outlook
In conclusion, the EURUSD Day Chart remains in a corrective phase with navy blue wave 2 in progress. Once gray wave C completes, navy blue wave 3 is expected, potentially signaling a return to the primary trend. The analysis remains valid unless the price breaches 1.12136, at which point the wave count would be rendered invalid.
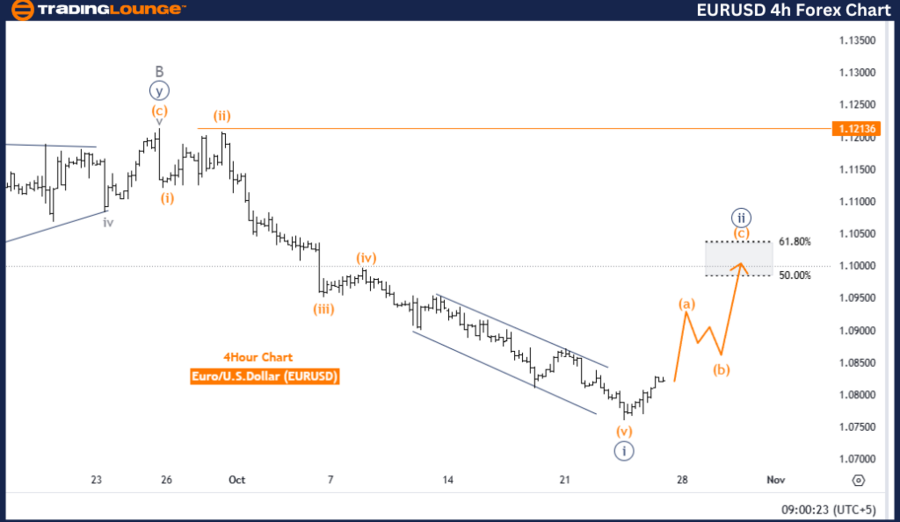
Euro/U.S. Dollar (EURUSD) Currency Pair - Tradinglounge 4-Hour Chart
Euro/U.S. Dollar Elliott Wave Technical Analysis
Function: Counter Trend
Mode: Corrective
Wave Structure: Navy Blue Wave 2
Position: Gray Wave C
Next Lower Degree Direction: Navy Blue Wave 3
Details: Navy blue wave 1 appears completed; navy blue wave 2 is active.
Wave Cancel Level: 1.12136
EURUSD 4-Hour Chart Analysis Summary
The EURUSD 4-hour chart’s Elliott Wave analysis signals a counter-trend within a corrective structure. The primary wave under observation is navy blue wave 2, activated following the end of navy blue wave 1. This corrective structure suggests a temporary reversal opposing the primary trend, indicative of a pullback within the larger market context.
Currently, the EURUSD is in gray wave C, the final phase of navy blue wave 2. This phase implies the correction may be nearing its end. Following gray wave C, the analysis anticipates navy blue wave 3, potentially marking a return to the impulsive direction as the correction concludes.
The end of navy blue wave 1 signifies a major impulsive phase, positioning the market in a retracement within navy blue wave 2, typical in Elliott Wave theory. This stage functions as a temporary pause before the trend resumes, depending on wave 3’s progression.
The wave cancellation level is set at 1.12136. A decline below this point would invalidate the current wave count, suggesting a possible alteration in wave structure and requiring a reevaluation of the market’s outlook.
Summary of EURUSD 4-Hour Chart Outlook
In summary, the EURUSD 4-hour chart remains in a corrective mode with navy blue wave 2 underway. After gray wave C concludes, navy blue wave 3 is expected, potentially resuming the primary trend. The current wave structure remains valid unless the price falls below 1.12136, which would invalidate this analysis.
Technical Analyst: Malik Awais
Source: visit Tradinglounge.com and learn From the Experts Join TradingLounge Here
Previous: U.S. Dollar / Japanese Yen (USDJPY) Elliott Wave Technical Analysis
VALUE Offer - Buy 1 Month & Get 3 Months!Click here
Access 7 Analysts Over 200 Markets Covered. Chat Room With Support