Silver Elliott Wave Analysis – March 2025
Silver remains in a bullish Elliott Wave cycle, which began in August 2022. The current uptrend is expected to push above the October 2024 high, marking a new peak in this cycle. In the short term, a smaller impulse wave has been forming since December 2024, with potential to break above $40 in the coming weeks.
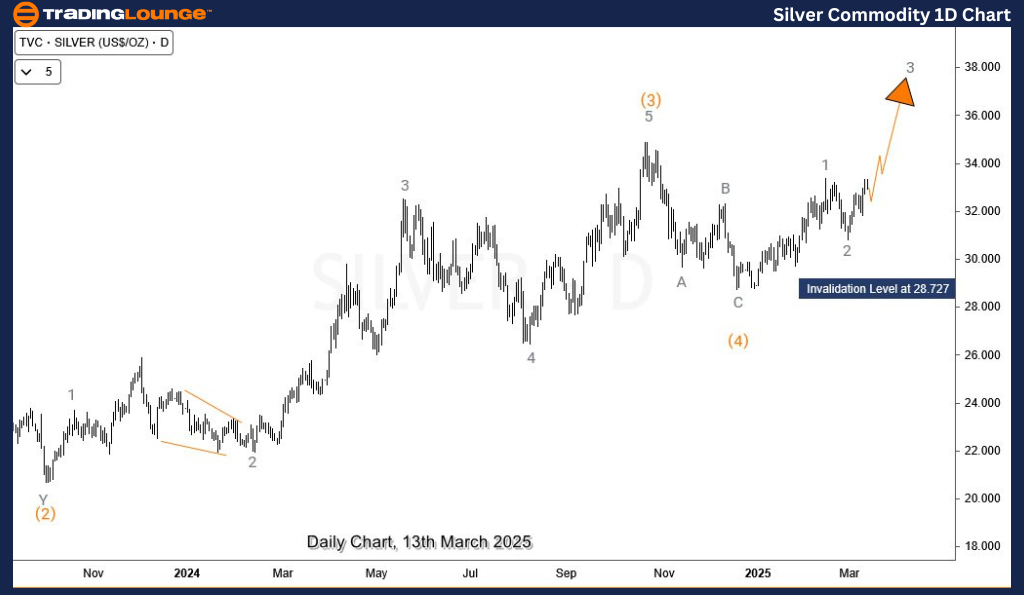
Silver Daily Chart Analysis
The daily chart highlights silver's bullish impulse cycle that started in August 2022, where wave II of the cycle degree concluded. Since then, wave III has been in progress, currently developing its first sub-wave ((1)) of I.
- From December 2024, silver began wave (5) of ((1)) of I, following the completion of wave (4).
- Waves 1 and 2 of (5) have completed, setting up a strong foundation for further upside.
- Silver is expected to continue rallying within wave (5) of ((1)), with a potential target of $40+ in the coming weeks.
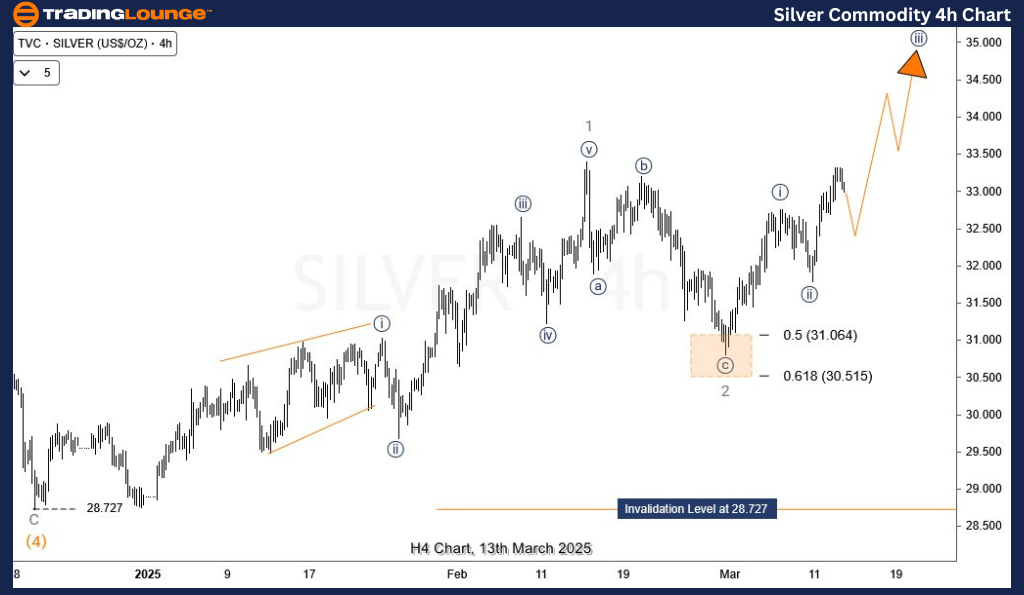
Silver H4 Chart Analysis
On the H4 chart, wave 3 began in late February 2025 near $30.8. Current developments suggest that sub-waves ((i)) and ((ii)) of 3 have likely completed.
- Given their proportions, wave ((iii)) is expected to extend, driving prices higher.
- An alternate count suggests that the February 28th low marked the start of (i) and (ii) of ((i)), leading to an extended wave 3 rally.
- Regardless of the scenario, further upside is expected. Traders should monitor pullbacks for potential entry opportunities.
Technical Analyst: Sanmi Adeagbo
Source: Visit Tradinglounge.com and learn from the Experts Join TradingLounge Here
See Previous: Gold Elliott Wave Technical Analysis
VALUE Offer - Buy 1 Month & Get 3 Months!Click here
Access 7 Analysts Over 200 Markets Covered. Chat Room With Support