ASX: Commonwealth Bank of Australia - CBA Elliott Wave Analysis (1D Chart)
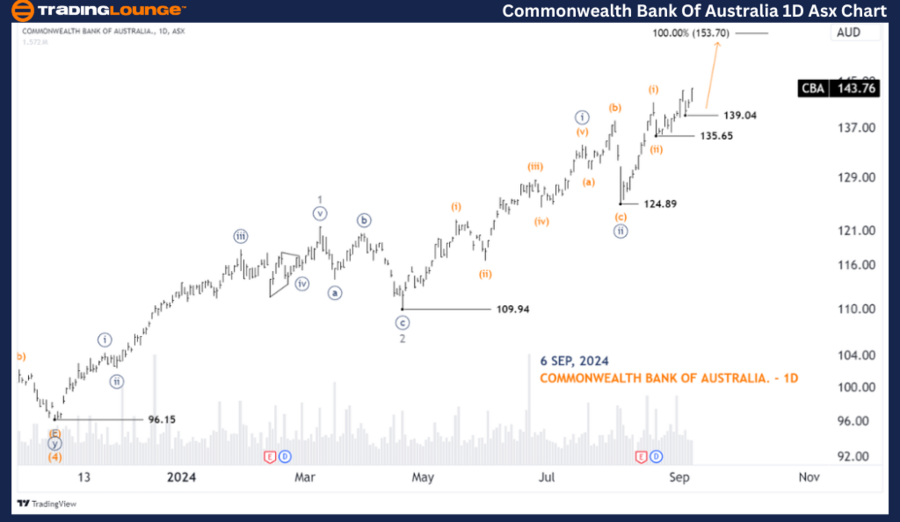
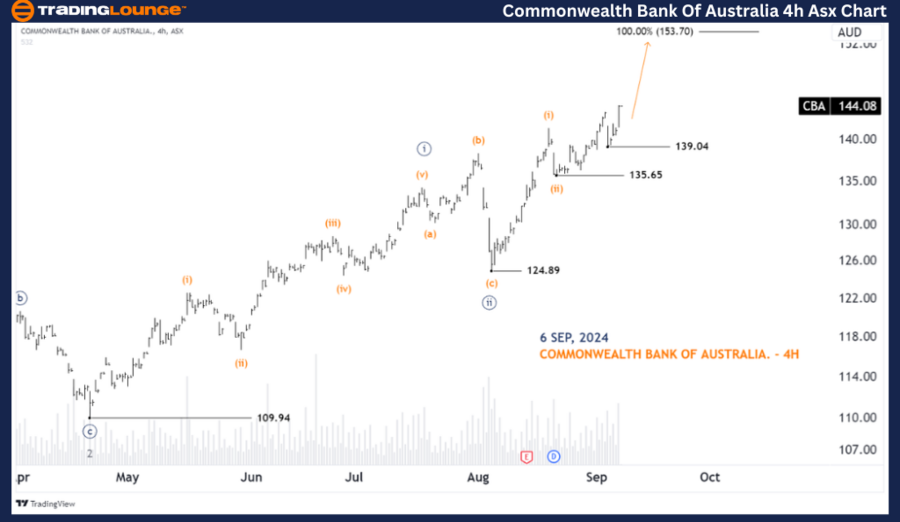
Greetings, today's Elliott Wave analysis provides an updated view of the Australian Stock Exchange (ASX) for Commonwealth Bank of Australia (CBA). We observe CBA.ASX showing bullish potential, with wave (iii) of ((iii)) unfolding.
CBA Elliott Wave Technical Analysis
ASX: Commonwealth Bank of Australia - CBA 1D Chart (Semilog Scale) Analysis
Function: Major trend (Minor degree, gray)
Mode: Motive
Structure: Impulse
Position: Wave (iii)-orange of Wave ((iii))-navy
Details:
Wave (ii)-orange concluded earlier than anticipated, and wave (iii)-orange is progressing higher. The low at 139.04 serves as a temporary key level.
Invalidation point: 135.65

ASX: Commonwealth Bank of Australia - CBA 4-Hour Chart Analysis
Function: Major trend (Minor degree, gray)
Mode: Motive
Structure: Impulse
Position: Wave (iii)-orange of Wave ((iii))-navy
Details:
Wave (ii)-orange wrapped up sooner than expected, and wave (iii)-orange is advancing towards the high at 153.70. Price holding above 139.04 supports this bullish outlook.
Invalidation point: 135.65
Technical Analyst: Hua (Shane) Cuong, CEWA-M (Master’s Designation).
Source: visit Tradinglounge.com and learn From the Experts Join TradingLounge Here
See Previous: ASX: SOUTH32 LIMITED – S32 Elliott Wave Technical Analysis
Special Trial Offer - 0.76 Cents a Day for 3 Months! Click here
Access 7 Analysts Over 200 Markets Covered. Chat Room With Support

Conclusion:
Our Elliott Wave analysis and short-term forecast for ASX: Commonwealth Bank of Australia (CBA) aim to provide readers with actionable insights into current market trends. We offer clear price points to validate or invalidate our wave count, enhancing confidence in the analysis. This approach allows traders to better understand market conditions and capitalize on potential opportunities.