AXIS BANK LTD – AXISBANK Elliott Wave Analysis TradingLounge (1D Chart)

AXIS BANK LTD – Axis Bank Daily Chart Technical Analysis

Function: Counter Trend (Minor degree, Grey. Wave A unfolding)

Mode: Corrective

Structure: Potential Impulse

Position: Minor Wave 2 Grey of A complete

Details: Minor Wave 3 Grey should turn lower soon, targeting levels below 1345.

Invalidation Point: 1340-50.

AXISBANK Elliott Wave Technical Analysis and Potential Counts:

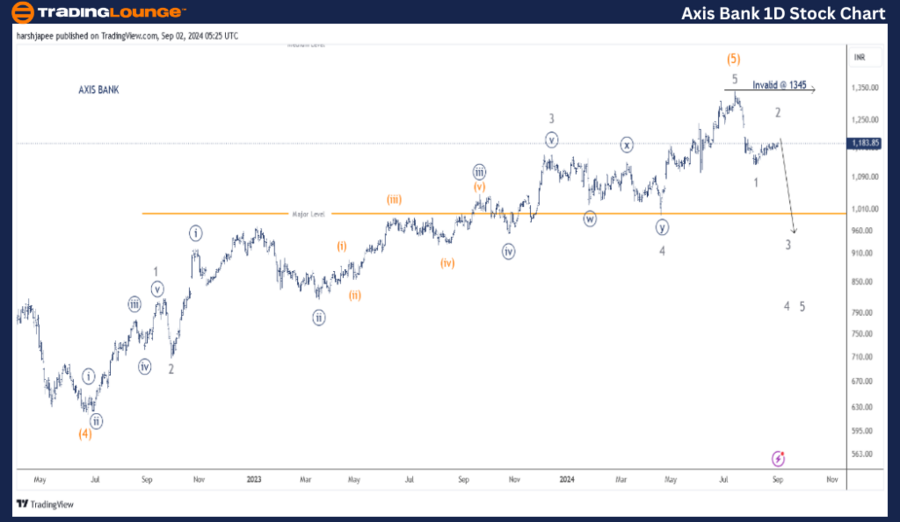
The Axis Bank daily chart suggests that a larger degree trend might have completed around the 1345 level in July 2024. The stock appears to have ended its fifth wave at multiple degrees as indicated on the chart. If this analysis is correct, a larger degree corrective wave is now likely to unfold against the 1345 level.

Since the low of June 2022, around 620 levels, Axis Bank has been trending higher, also completing Intermediate Wave (4) Orange. This entire rally can be subdivided into five waves, culminating at the 1345 mark, indicating the end of the Intermediate Wave (5).

Given this structure, prices are expected to move lower towards the 998 level in the medium term, which would confirm a deeper correction ahead. It appears that Minor Waves 1 and 2 are complete, setting the stage for Wave 3 to resume its downward trajectory.

Axis-Bank-Ltd-1D-Sto...


AXIS BANK LTD – TradingLounge AXISBANK (4H Chart) Elliott Wave Analysis:

Function: Counter Trend (Minor degree, Grey. Wave A unfolding)

Mode: Corrective

Structure: Potential Impulse

Position: Minor Wave 2 Grey of (A) complete

Details: Minor Wave 2 is either complete around 1190 or nearing completion. If this holds, Minor Wave 3 Grey should turn lower from here.

Invalidation Point: 1340-50.

Axis Bank 4H Chart Technical Analysis and Potential Elliott Wave Counts:

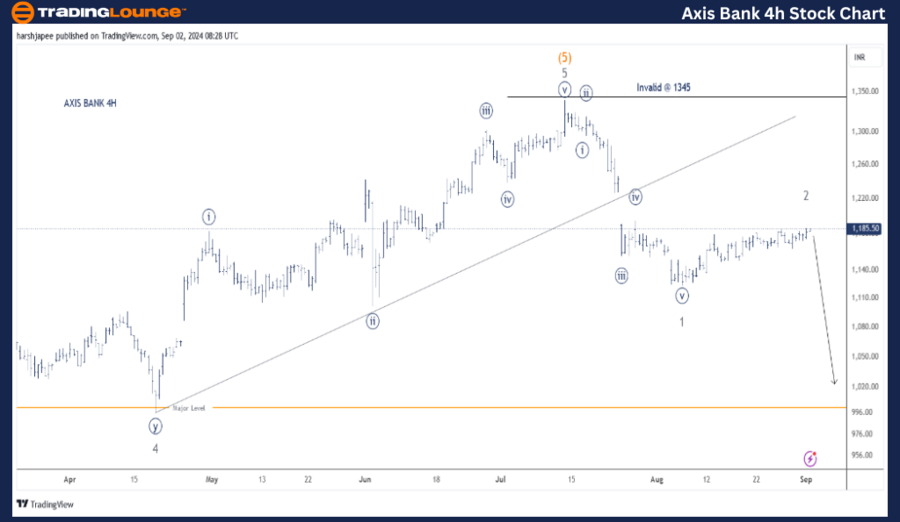
The Axis Bank 4H chart provides a closer view since Minor Wave 4 ended around the 998 level in April 2024. The rally towards 1345 can be subdivided into five waves, marking the end of Minor Wave 5 Grey. If this analysis is correct, prices should remain below the 1345 level going forward.

Additionally, the stock may have already initiated its first impulse drop from the 1345 highs, nearing the 1125 level. Alternatively, Minute Wave ((iv)) could still be unfolding, with one more leg lower required to complete Minor Wave 1 Grey. In either scenario, the stock is expected to remain under pressure as long as it stays below 1345.

Technical Analyst: Harsh Japee

Source: visit Tradinglounge.com and learn From the Experts Join TradingLounge Here 

Previous: Kotak Mahindra Bank Elliott Wave Technical Analysis

Special Trial Offer - 0.76 Cents a Day for 3 Months! Click here

Access 7 Analysts Over 200 Markets Covered. Chat Room With Support

Axis-Bank-Ltd-4h-Sto...


Conclusion:

Axis Bank is anticipated to decline further as Minor Wave 3 begins to unfold, with strong resistance around the 1345 highs.

Related

Optimize Your Asx Trading Strategies: RESMED INC - RMD Stock Analysis & Elliott Wave Technical Forecast

Optimize Your Asx Trading Strategies: RESMED INC - RMD Stock Analysis & Elliott Wave Technical Forecast

This article provides a comprehensive Elliott Wave analysis of ASX: ResMed Inc (RMD), offering insig...

Read More >
New Zealand Dollar/U.S.Dollar(NZDUSD) Forex Elliott Wave Technical Analysis: In-Depth Overview for Traders

New Zealand Dollar/U.S.Dollar(NZDUSD) Forex Elliott Wave Technical Analysis: In-Depth Overview for Traders

Elliott Wave analysis of the NZDUSD currency pair, covering day and 4-hour charts highlights key tre...

Read More >
Providing a Well-Rounded View of Salesforce's Stock Performance and Forecast: Salesforce Inc (CRM) Elliott Wave Analysis

Providing a Well-Rounded View of Salesforce's Stock Performance and Forecast: Salesforce Inc (CRM) Elliott Wave Analysis

This analysis provides a comprehensive look at Salesforce (CRM) stock using Elliott Wave Theory. It ...

Read More >
Chainlink/U.S. dollar (LINKUSD) Elliott Wave Technical Analysis 26 October 23

Chainlink/U.S. dollar (LINKUSD) Elliott Wave Technical Analysis 26 October 23

Chainlink/U.S. dollar (LINKUSD) Elliott Wave Technical Analysis for 26 October 23, Elliott Wave Anal...

Read More >
Federal Reserve Cuts Rates to 5%: Elliott Wave Analysis of Major Stock Indices & Market Insights

Federal Reserve Cuts Rates to 5%: Elliott Wave Analysis of Major Stock Indices & Market Insights

This blog offers an in-depth analysis of major stock market indices—including the S&P 500, NASDAQ 1...

Read More >
Optimize Your Asx Trading Strategies: RESMED INC - RMD Stock Analysis & Elliott Wave Technical Forecast

Optimize Your Asx Trading Strategies: RESMED INC - RMD Stock Analysis & Elliott Wave Technical Forecast

This article provides a comprehensive Elliott Wave analysis of ASX: ResMed Inc (RMD), offering insig...

Read More >
New Zealand Dollar/U.S.Dollar(NZDUSD) Forex Elliott Wave Technical Analysis: In-Depth Overview for Traders

New Zealand Dollar/U.S.Dollar(NZDUSD) Forex Elliott Wave Technical Analysis: In-Depth Overview for Traders

Elliott Wave analysis of the NZDUSD currency pair, covering day and 4-hour charts highlights key tre...

Read More >
Providing a Well-Rounded View of Salesforce's Stock Performance and Forecast: Salesforce Inc (CRM) Elliott Wave Analysis

Providing a Well-Rounded View of Salesforce's Stock Performance and Forecast: Salesforce Inc (CRM) Elliott Wave Analysis

This analysis provides a comprehensive look at Salesforce (CRM) stock using Elliott Wave Theory. It ...

Read More >
Chainlink/U.S. dollar (LINKUSD) Elliott Wave Technical Analysis 26 October 23

Chainlink/U.S. dollar (LINKUSD) Elliott Wave Technical Analysis 26 October 23

Chainlink/U.S. dollar (LINKUSD) Elliott Wave Technical Analysis for 26 October 23, Elliott Wave Anal...

Read More >
Federal Reserve Cuts Rates to 5%: Elliott Wave Analysis of Major Stock Indices & Market Insights

Federal Reserve Cuts Rates to 5%: Elliott Wave Analysis of Major Stock Indices & Market Insights

This blog offers an in-depth analysis of major stock market indices—including the S&P 500, NASDAQ 1...

Read More >

Buy 1 Month

Get 3 Months!

Special Offer:

Trade Recommendations

Unleash the power of deversified trading with our comprehensive portfolio, covering:

  • Stock Trades
  • Crypto Trades
  • Forex Trades
  • Commodity Trades
Elliott Wave Analysis

Gain a competive edge with expert insights in to:

  • Global Indices
  • US Stocks & ASX Stocks
  • Forex & Crypto
  • Commodities
Top-Notch Trading Tools

Equip yourself with the tools of success:

  • Social Chat
  • Elliott Wave Algorithm
  • Screener
  • TradingLevels
  • Trading Game
7 Elliott Wave Analysts

Stay ahead of the market with daily charts and insightful videos
-Your secret to strategic trading!

JOIN HERE


Welcome to TradingLounge (ASIC A.R.No. 321187), specialists in trades, trading education and technical analysis, covering stocks, indices, commodities, forex and cryptocurrencies.

When you join TradingLounge you have access to everything we offer, including trade tools, educational content and a social platform to chat with like-minded investors.

Read more

@Copyright 2024 by tradinglounge.com

Contact Us

Australian no: 02 4787 6020

International no: +61 (2) 47876020

Pay with:

Find us on