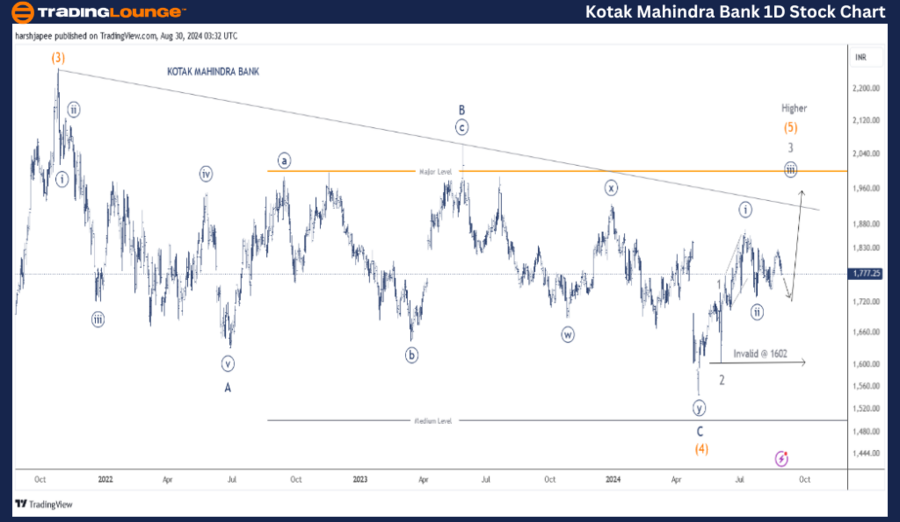
Kotak Mahindra Bank, KOTAKBANK Elliott Wave Analysis 1D Chart

Kotak Mahindra Bank (KOTAKBANK ) Day Chart Analysis

  • Function: Larger Degree Trend Higher (Intermediate degree, orange)

  • Mode: Motive

  • Structure: Impulse

  • Position: Minute Wave ((ii)) Navy

  • Details: Minute Wave ((iii)) is developing within Minor Wave 3 Grey of Intermediate Wave (5) Orange, with 1602 as the critical support level.

  • Invalidation point: 1602

Kotak Mahindra Bank Elliott Wave Technical Analysis and Outlook

The Kotak Mahindra Bank daily chart suggests an ongoing uptrend, with Minute Wave ((iii)) Navy potentially advancing towards the 2100 level, provided prices remain above the 1600 support zone. Currently, the stock is consolidating, but a breakout above 1830 could trigger a stronger upward momentum.

The bank's stock has experienced a significant correction since the October 2021 peak around 2250. The Minor Wave A-B-C correction unfolded down to the 1500 lows observed in May 2024. Now, Intermediate Wave (5) is in progress, indicating a possible continuation of the upward trend.

Although Kotak Mahindra Bank has underperformed compared to the Nifty 50 Index, which is at an all-time high, a bullish acceleration could occur as Minor Wave 3 progresses within Intermediate Wave (5) Orange.

Kotak-Mahindra-Bank-...


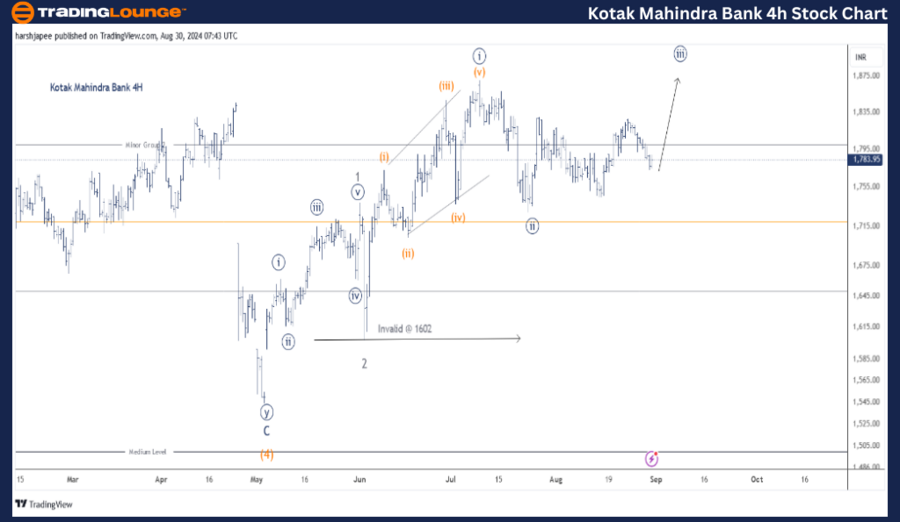
Kotak Mahindra Bank, KOTAKBANK Elliott Wave Analysis 4H Chart

Kotak Mahindra Bank (KOTAKBANK ) 4-Hour Chart Analysis

Kotak Mahindra Bank Stock Technical Analysis

  • Function: Larger Degree Trend Higher (Intermediate degree, orange)

  • Mode: Motive

  • Structure: Impulse

  • Position: Minute Wave ((ii)) Navy

  • Details: Minute Wave ((iii)) is developing within Minor Wave 3 Grey of Intermediate Wave (5) Orange, with 1602 as the key support level. Minute Wave ((ii)) may end as a triangle.

  • Invalidation point: 1602

Kotak Mahindra Bank Stock Analysis and Elliott Wave Scenarios

The 4H chart provides a detailed view of the sub-waves since the 1540 low formed in May 2024. An impulse wave completed Minor Wave 1 Grey around 1735, followed by a sharp correction that formed Minor Wave 2.

Minor Wave 3 is likely subdividing into Minute Waves ((i)) and possibly ((ii)), with the latter forming near the 1865 and 1720 levels, respectively. Additionally, there is a possibility that Minute Wave ((ii)) could evolve as a triangle before it concludes.

Technical Analyst: Harsh Japee

Source: visit Tradinglounge.com and learn From the Experts Join TradingLounge Here 

Previous: State Bank of India Elliott Wave Technical Analysis

Special Trial Offer - 0.76 Cents a Day for 3 Months! Click here

Access 7 Analysts Over 200 Markets Covered. Chat Room With Support

Kotak-Mahindra-Bank-...


Conclusion:

Kotak Mahindra Bank is trending higher within Minute Wave ((iii)) Navy of Minor Wave 3 Grey as Intermediate Wave (5) Orange unfolds. The bullish outlook remains valid as long as the price stays above the 1602 level.

Related

Euro Stoxx 50 Index Elliott Wave Technical Analysis Exhibits a Strong Bullish Trend on the Daily and Weekly Chart

Euro Stoxx 50 Index Elliott Wave Technical Analysis Exhibits a Strong Bullish Trend on the Daily and Weekly Chart

The Euro Stoxx 50 index exhibits a strong bullish trend on the weekly chart, with an impulsive Orang...

Read More >
Corn Price Forecast: Elliott Wave Technical Analysis and Market Trends

Corn Price Forecast: Elliott Wave Technical Analysis and Market Trends

Discover how corn prices are moving with a detailed Elliott Wave analysis, offering insights into cu...

Read More >
XRP Ripple Crypto Price News Today Elliott Wave Technical Analysis: Focusing on XRP's Potential Wave III Uptrend

XRP Ripple Crypto Price News Today Elliott Wave Technical Analysis: Focusing on XRP's Potential Wave III Uptrend

This article provides an in-depth XRPUSD Elliott Wave analysis, focusing on XRP's potential Wave...

Read More >
Saudi Stock Market Update: TASI Index Elliott Wave Technical Analysis Shows an Impulsive Bullish Trend

Saudi Stock Market Update: TASI Index Elliott Wave Technical Analysis Shows an Impulsive Bullish Trend

The TASI Index is currently in an impulsive bullish trend, with the market advancing through gray wa...

Read More >
U.S.Dollar /Canadian Dollar(USD/CAD) Elliott Wave Technical Analysis 17 November 23

U.S.Dollar /Canadian Dollar(USD/CAD) Elliott Wave Technical Analysis 17 November 23

U.S.Dollar /Canadian Dollar(USD/CAD) Elliott Wave Technical Analysis 17 November 23, provides a comp...

Read More >

$1 for 2 Weeks

then $29 a month!

What a Special Offer!

Trade Recommendations

Unleash the power of deversified trading with our comprehensive portfolio, covering 250+ markets:

  • Stock Trades
  • Crypto Trades
  • Forex Trades
  • Commodity Trades
Elliott Wave Analysis

Gain a competitive edge with expert insights and AI-powered Elliott Wave charting into:

  • Global Indices
  • US Stocks & ASX Stocks
  • Forex & Crypto
  • Commodities
Top-Notch Trading Tools

Equip yourself with the tools of success:

  • Real-time Chat rooms
  • Elliott Wave Algorithm
  • Portfolio tools
  • TradingLevels
  • Screener
  • Trading Game
7 Elliott Wave Analysts

Stay ahead of the market with daily charts and insightful videos
Your secret to strategic trading!

JOIN HERE


Welcome to TradingLounge (ASIC A.R.No. 321187), specialists in trades, trading education and technical analysis, covering stocks, indices, commodities, forex and cryptocurrencies.

When you join TradingLounge you have access to everything we offer, including trade tools, educational content and a social platform to chat with like-minded investors.

Read more

@Copyright 2024 by tradinglounge.com

Contact Us

Australian no: 02 4787 6020

International no: +61 (2) 47876020

Pay with:

Find us on