29Aug

Elliott Wave Technical Analysis for State Bank of India (SBI) Stock: Predicting Future Price Movements and Key Trading Levels

STATE BANK OF INDIA – SBIN Elliott Wave Analysis (1D Chart)

Function: Larger Degree Trend Higher (Intermediate degree, orange)

Mode: Motive

Structure: Impulse

Position: Minute Wave ((ii))

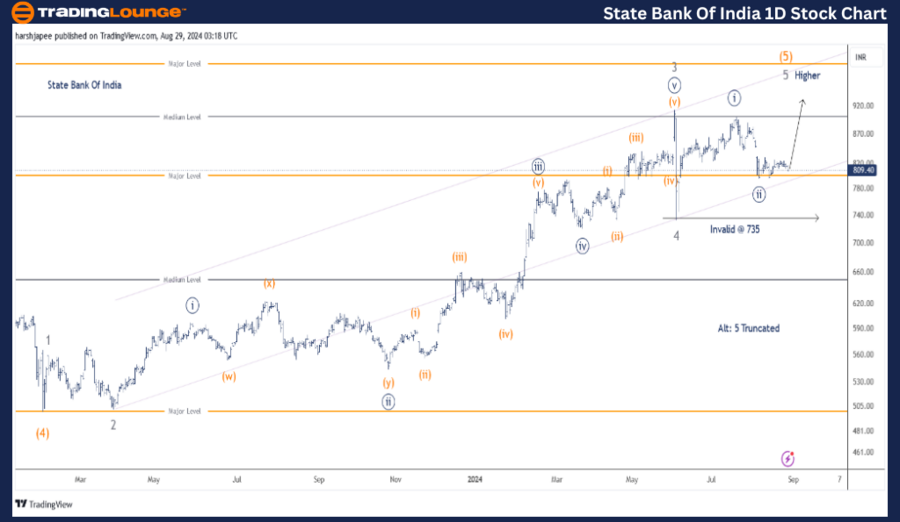
Details: Minute Wave ((ii)) Navy is likely complete around 810. If this is accurate, prices should rise as Minute Wave ((iii)) Navy begins to develop within Minor Wave 5 Grey of Intermediate Wave (5) Orange. Alternatively, Minor Wave 5 Grey might have ended as a truncation below 920.

Invalidation point: 735

SBIN Elliott Wave Technical Analysis

State Bank of India Daily Chart Technical Analysis and Potential Elliott Wave Counts:

The daily chart for State Bank of India suggests a continued upward movement above 920 levels as Minute Wave ((iii)) unfolds within Minor Wave 5 Grey, leading to the completion of Intermediate Wave (5) Orange. If this scenario holds, the interim low near 800 levels should remain intact.

Since February 2023, the stock has been on an upward trend after completing Intermediate Wave (4) around the 500 mark. Analyzing the sub-waves, Minor Waves 1, 2, 3, and 4 appear complete, with Wave 5 Grey unfolding above the 735 level.

If the larger degree trend continues as expected, prices should remain above 735, potentially leading to an impulse that completes Minor Wave 5 Grey. Alternatively, if Wave 5 Grey was truncated, it may have concluded around the 920 highs.

State-Bank-of-India-...


STATE BANK OF INDIA – SBIN Elliott Wave Analysis (4H Chart):

Function: Larger Degree Trend Higher (Intermediate degree, orange)

Mode: Motive

Structure: Impulse

Position: Minute Wave ((ii))

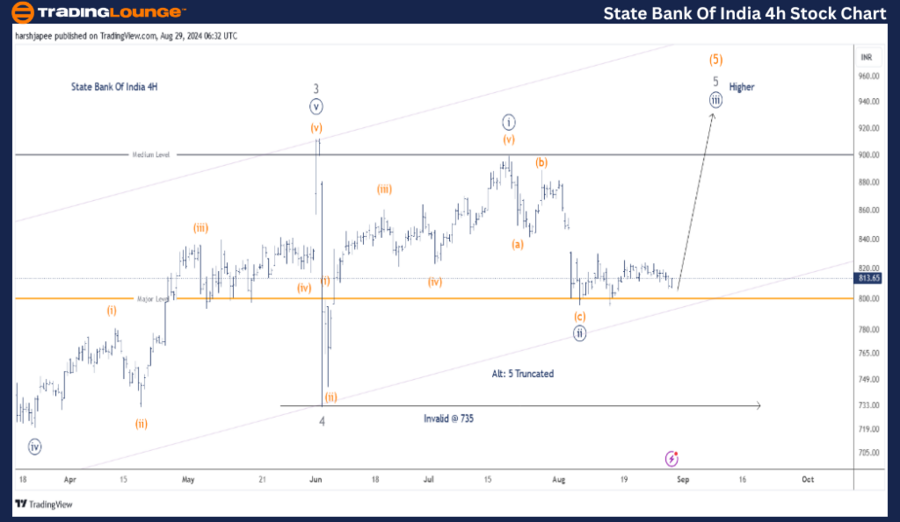
Details: Minute Wave ((ii)) Navy seems to be complete around 810. If accurate, prices should rise as Minute Wave ((iii)) Navy starts to develop within Minor Wave 5 Grey of Intermediate Wave (5) Orange. Alternatively, if Minor Wave 5 Grey has already ended as a truncation below 920, the stock could continue downward, producing an impulse wave.

Invalidation point: 735

State Bank of India 4H Chart Technical Analysis and Potential Elliott Wave Counts:

The 4H chart of State Bank of India provides a detailed view of Minute Waves ((i)) and ((ii)) Navy since Minor Wave 4 ended near the 735 level. The stock has completed an impulse wave (Minuette waves (i) through (v) orange) between 735 and 920, marking the end of Minute Wave ((i)).

Additionally, Minute Wave ((ii)) has formed a Zigzag pattern. If this analysis is correct, Minute Wave ((iii)) should commence shortly, targeting the 735 mark.

Technical Analyst: Harsh Japee

Source: visit Tradinglounge.com and learn From the Experts Join TradingLounge Here 

Previous: Reliance Industries Elliott Wave Technical Analysis 

Special Trial Offer - 0.76 Cents a Day for 3 Months! Click here

Access 7 Analysts Over 200 Markets Covered. Chat Room With Support

State-Bank-of-India-...


Conclusion:

State Bank of India appears to be advancing higher, with a potential move above 920 as Minute Wave ((iii)) progresses within Intermediate Wave (5) Orange. A break below 735 would indicate that the alternate scenario is likely unfolding.

Related

DIS Elliott Wave Analysis: Identifying Trading Opportunities for The Walt Disney Company (DIS)

DIS Elliott Wave Analysis: Identifying Trading Opportunities for The Walt Disney Company (DIS)

DIS Elliott Wave Analysis for The Walt Disney Company (DIS), reveals potential for both bullish and ...

Read More >
Euro/ U.S. Dollar (EURUSD) Elliott Wave Technical Analysis - Confirming a Bullish Trend with Impulse Waves in Play

Euro/ U.S. Dollar (EURUSD) Elliott Wave Technical Analysis - Confirming a Bullish Trend with Impulse Waves in Play

This EURUSD Elliott Wave analysis provides a detailed forecast of price movements, confirming a bull...

Read More >
WTI Crudeoil Commodity Elliott Wave Technical analysis: Forecast future trends

WTI Crudeoil Commodity Elliott Wave Technical analysis: Forecast future trends

In this detailed analysis, we delve into the WTI Crude Oil market using Elliott Wave theory. We exam...

Read More >
VanEck Rare Earth & Strategic Metals ETF (REMX) Elliott Wave Analysis: Zigzag Pattern, and ETF Trading Strategy Insights

VanEck Rare Earth & Strategic Metals ETF (REMX) Elliott Wave Analysis: Zigzag Pattern, and ETF Trading Strategy Insights

VanEck Rare Earth & Strategic Metals ETF (REMX), focusing on the wave 4 correction within a zigzag s...

Read More >
GDX Elliott Wave Forecast Reveals VanEck Gold Miners ETF in Early Rally with Price Target Near $49 and Trading Opportunity

GDX Elliott Wave Forecast Reveals VanEck Gold Miners ETF in Early Rally with Price Target Near $49 and Trading Opportunity

This Elliott Wave analysis of the VanEck Gold Miners ETF (GDX) reveals a developing uptrend with bul...

Read More >
Unlocking ASX Trading Success: QBE INSURANCE GROUP LIMITED – QBE Stock Analysis & Elliott Wave Technical Forecast

Unlocking ASX Trading Success: QBE INSURANCE GROUP LIMITED – QBE Stock Analysis & Elliott Wave Technical Forecast

Our detailed Elliott Wave analysis of QBE Insurance Group (ASX: QBE) highlights key price trends and...

Read More >

$1 for 2 Weeks

then $29 a month!

What a Special Offer!

Trade Recommendations

Unleash the power of deversified trading with our comprehensive portfolio, covering 250+ markets:

  • Stock Trades
  • Crypto Trades
  • Forex Trades
  • Commodity Trades
Elliott Wave Analysis

Gain a competitive edge with expert insights and AI-powered Elliott Wave charting into:

  • Global Indices
  • US Stocks & ASX Stocks
  • Forex & Crypto
  • Commodities
Top-Notch Trading Tools

Equip yourself with the tools of success:

  • Real-time Chat rooms
  • Elliott Wave Algorithm
  • Portfolio tools
  • TradingLevels
  • Screener
  • Trading Game
7 Elliott Wave Analysts

Stay ahead of the market with daily charts and insightful videos
Your secret to strategic trading!

JOIN HERE


Welcome to TradingLounge (ASIC A.R.No. 321187), specialists in trades, trading education and technical analysis, covering stocks, indices, commodities, forex and cryptocurrencies.

When you join TradingLounge you have access to everything we offer, including trade tools, educational content and a social platform to chat with like-minded investors.

Read more

@Copyright 2024 by tradinglounge.com

Contact Us

Australian no: 02 4787 6020

International no: +61 (2) 47876020

Pay with:

Find us on