13Feb

ASX:NEM - Newmont Corporation Elliott Wave Analysis, Trading Strategies & ASX Market Trends for Long-Term Investors

ASX: NEWMONT CORPORATION - NEM Elliott Wave Technical Analysis

Greetings,

This Elliott Wave analysis provides a fresh outlook on the Australian Stock Exchange (ASX) Newmont Corporation (ASX: NEM) with a technical approach for traders and investors.

Our analysis indicates that ASX :NEM has strong long-term bullish potential, currently unfolding within the third wave of the third wave. This report highlights key price levels and optimal trading setups using a data-driven, visually guided approach to confirm market trends.


ASX: NEWMONT CORPORATION - NEM 1D Chart (Semilog Scale) Analysis

Function: Major trend (Intermediate degree, orange)

Mode: Motive

Structure: Impulse

Position: Wave 1 - grey of Wave (3) - orange

Details:

  • Wave (2) - orange likely completed at 58.92, signaling the potential start of Wave (3) - orange, which is expected to push higher.
  • The structure suggests an Extended Wave, where Wave 1 - grey is nearing completion before a minor rally.
  • Upon completion of Wave 1 - grey, Wave 2 - grey is anticipated, setting up a potential long trade opportunity.

 Invalidation Point: 58.92

newmont-corporation-...


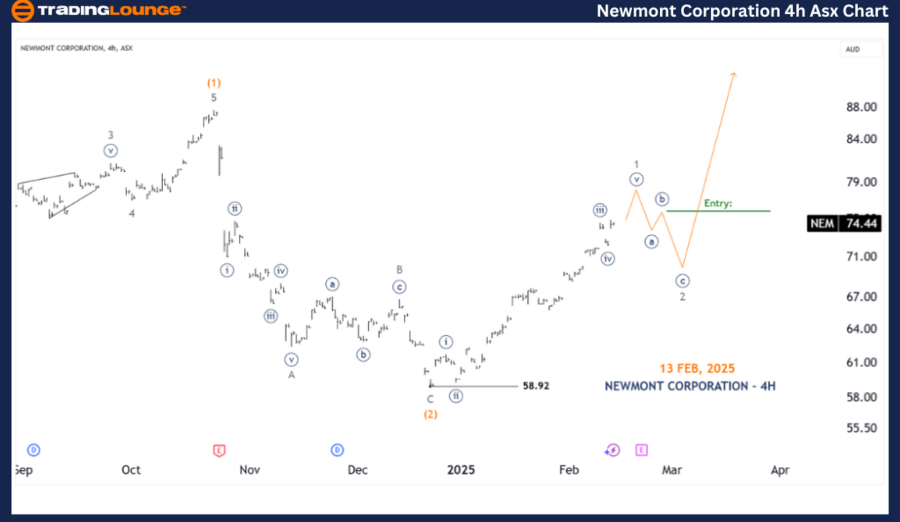
ASX: NEWMONT CORPORATION - NEM 4-Hour Chart Analysis

Function: Major trend (Minute degree, navy)

Mode: Motive

Structure: Impulse

Position: Wave ((v)) - navy of Wave 1 - grey

Details:

  • From the 58.92 low, Wave 1 - grey is nearing completion, displaying a five-wave structure from Wave ((ii)) - navy to Wave ((v)) - navy.
  • The next anticipated move is a corrective decline into Wave 2, providing traders a chance to wait for a breakout above Wave ((b)) - navy of Wave 2 - grey before considering a long trade setup.

 Invalidation Point: 58.92
 Key Level: End of Wave ((b)) - navy

Technical Analyst: Hua (Shane) Cuong, CEWA-M (Master’s Designation).

Source: visit Tradinglounge.com and learn From the Experts Join TradingLounge Here 

See Previous: COMMONWEALTH BANK OF AUSTRALIA - CBA Elliott Wave Technical Analysis

VALUE Offer - Buy 1 Month & Get 3 Months!Click here

Access 7 Analysts Over 200 Markets Covered. Chat Room With Support

newmont-corporation-...


Conclusion

This Elliott Wave analysis offers a structured trading forecast for ASX: Newmont Corporation (NEM), providing a clear technical roadmap to navigate current market conditions. By identifying critical validation and invalidation levels, we aim to enhance confidence in trend projections and market positioning.

Our objective, data-backed approach ensures traders receive insights into the market context and high-probability trading opportunities.

Related

Elliott Wave Analysis Update: Stability and Opportunities in Commodity Markets

Elliott Wave Analysis Update: Stability and Opportunities in Commodity Markets

The latest Elliott Wave analysis of commodity markets shows unchanged wave counts. Bitcoin is confir...

Read More >
U.S. Dollar / Swiss Franc (USDCHF) Elliott Wave Technical Analysis – Expert Forecast, Trading Strategies and Price Predictions

U.S. Dollar / Swiss Franc (USDCHF) Elliott Wave Technical Analysis – Expert Forecast, Trading Strategies and Price Predictions

USD/CHF Elliott Wave analysis with detailed forecasts and technical insights. Learn about market tre...

Read More >
TRXUSD Elliott Wave Analysis: Trading Strategy & Market Trends for Massive Gains – Is TRX Ready for a Bullish Breakout? Find Out Now!

TRXUSD Elliott Wave Analysis: Trading Strategy & Market Trends for Massive Gains – Is TRX Ready for a Bullish Breakout? Find Out Now!

This TRXUSD Elliott Wave analysis provides insights into the current market structure, key support a...

Read More >
Unlocking ASX Trading Success: JAMES HARDIE INDUSTRIES PLC - JHX Stock Analysis & Elliott Wave Technical Forecast

Unlocking ASX Trading Success: JAMES HARDIE INDUSTRIES PLC - JHX Stock Analysis & Elliott Wave Technical Forecast

Explore an in-depth Elliott Wave analysis of ASX: JHX (James Hardie Industries), focusing on price t...

Read More >
Australian Dollar / Japanese Yen(AUDJPY) Charts Elliott Wave Technical Analysis 26 October 23

Australian Dollar / Japanese Yen(AUDJPY) Charts Elliott Wave Technical Analysis 26 October 23

In summary, the AUD/JPY Elliott Wave Analysis for 26 October 23, provides valuable information for t...

Read More >
ChainLink / U.S. dollar(LINKUSD) Elliott Wave Technical Analysis 2 November 23

ChainLink / U.S. dollar(LINKUSD) Elliott Wave Technical Analysis 2 November 23

Chainlink/U.S. dollar (LINKUSD) Elliott Wave Technical Analysis for 2 November 23, Elliott Wave Anal...

Read More >

Buy 1 Month

Get 3 Months!

Special Offer:

Trade Recommendations

Unleash the power of deversified trading with our comprehensive portfolio, covering:

  • Stock Trades
  • Crypto Trades
  • Forex Trades
  • Commodity Trades
Elliott Wave Analysis

Gain a competive edge with expert insights in to:

  • Global Indices
  • US Stocks & ASX Stocks
  • Forex & Crypto
  • Commodities
Top-Notch Trading Tools

Equip yourself with the tools of success:

  • Social Chat
  • Elliott Wave Algorithm
  • Screener
  • TradingLevels
  • Trading Game
7 Elliott Wave Analysts

Stay ahead of the market with daily charts and insightful videos
-Your secret to strategic trading!

JOIN HERE


Welcome to TradingLounge (ASIC A.R.No. 321187), specialists in trades, trading education and technical analysis, covering stocks, indices, commodities, forex and cryptocurrencies.

When you join TradingLounge you have access to everything we offer, including trade tools, educational content and a social platform to chat with like-minded investors.

Read more

@Copyright 2024 by tradinglounge.com

Contact Us

Australian no: 02 4787 6020

International no: +61 (2) 47876020

Pay with:

Find us on