GBPUSD Elliott Wave Analysis Trading Lounge Day Chart,
British Pound/U.S.Dollar(GBPUSD) Day Chart Analysis
GBPUSD Elliott Wave Technical Analysis
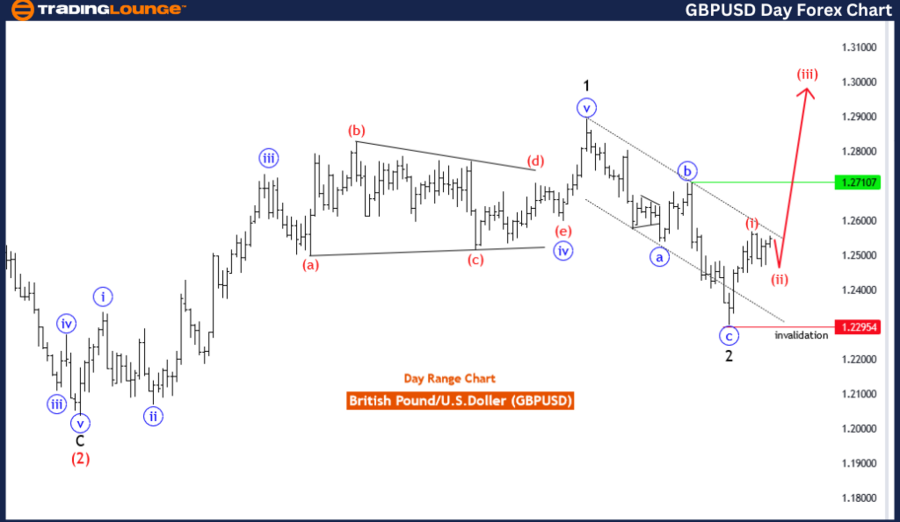
FUNCTION: Trend
MODE: corrective
STRUCTURE: red wave 2
POSITION: Blue Wave 1
DIRECTION NEXT HIGHER DEGREES: red wave 3
DETAILS: Red Wave 2 is in play and looking near to end. Wave Cancel invalid level: 1.22954
The GBP/USD Elliott Wave Analysis for the Day Chart examines the British Pound against the U.S. Dollar, using Elliott Wave theory to interpret market trends, corrective phases, and wave structure. This summary focuses on the broader context, highlighting the mode, structure, position, and key levels that define the current wave pattern.
Function
The function of the ongoing pattern is classified as "Trend," indicating that the overall market direction is moving in a continuous pattern, suggesting a broader Elliott Wave cycle.
Mode
The mode is described as "corrective," indicating that the current wave structure represents a consolidation phase within a broader trend. Corrective phases typically involve three smaller waves, indicating a temporary pause or sideways movement before the trend resumes.
Structure
The structure identified is "red wave 2," suggesting that the current corrective wave is part of a broader Elliott Wave sequence. Corrective structures are typically a series of three smaller waves, often indicating a period of consolidation within a larger trend.
Position
The position within the structure is "blue wave 1," indicating that the ongoing corrective pattern is part of a larger wave sequence. This implies that the broader trend, represented by blue wave 1, is currently undergoing a consolidation phase before likely resuming its trend.
Direction for the Next Higher Degrees
The direction for the next higher degrees is "red wave 3," indicating that once the current corrective phase (red wave 2) is complete, the market is expected to resume its impulsive trend, leading to further price movement.
Details
The details section notes that "Red Wave 2" is currently in play and appears to be nearing its end. The Wave Cancel invalid level is set at 1.22954, suggesting that if the market price drops below this level, the current wave structure may be invalidated, indicating a potential shift in trend.
In summary, the GBP/USD Elliott Wave Analysis for the Day Chart indicates that the market is in a corrective phase (red wave 2) within a broader trend (blue wave 1). This phase is likely approaching its end, with the subsequent impulsive phase (red wave 3) expected to begin soon. The Wave Cancel invalid level at 1.22954 acts as a critical threshold; if the price falls below this level, the existing wave pattern may be invalidated, necessitating a reevaluation of the broader trend and market direction.
GBPUSD Elliott Wave Analysis Trading Lounge 4-Hour Chart,
British Pound/U.S.Dollar(GBPUSD) 4 Hour Chart Analysis
GBPUSD Elliott Wave Technical Analysis
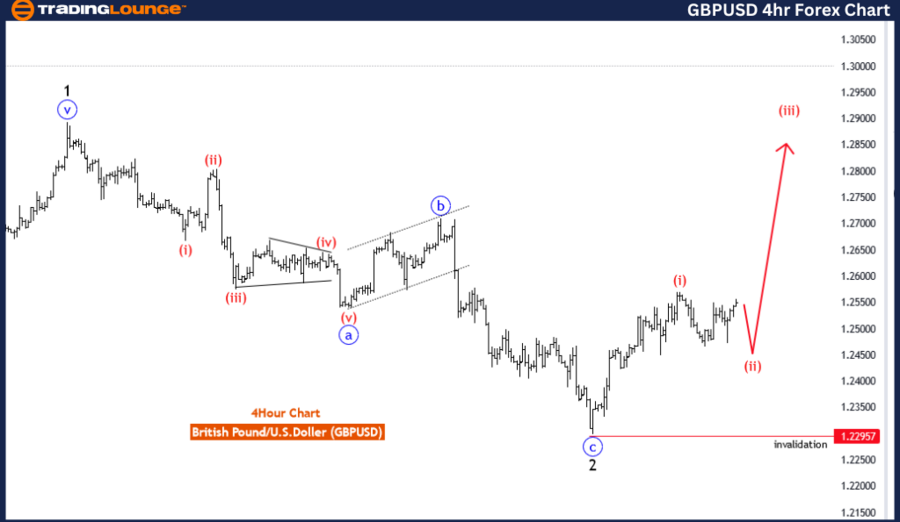
FUNCTION: Trend
MODE: Corrective
STRUCTURE: red wave 2
POSITION: Blue Wave 1
DIRECTION NEXT HIGHER DEGREES: red wave 3
DETAILS: Red Wave 2 is in play and looking near to end. Wave Cancel invalid level: 1.22957
The GBP/USD Elliott Wave Analysis for the 4-Hour Chart provides a detailed examination of the British Pound against the U.S. Dollar, focusing on the Elliott Wave structure to determine the trend, mode, and current wave position. It also outlines key levels to monitor for validating or invalidating the ongoing wave pattern.
Function
The function of the current market pattern is identified as "Trend," indicating that the general direction of the market is following a continuous movement, suggesting that the structure represents a larger wave cycle within the Elliott Wave framework.
Mode
The mode is "Corrective," indicating that the structure in play represents a correction within a larger trend, often characterized by sideways or counter-trend movements. This correction phase typically follows impulsive waves, allowing the market to consolidate before resuming its broader trend.
Structure
The structure highlighted is "red wave 2," suggesting that the current wave pattern is in a corrective phase of the broader trend. Corrective structures often involve three sub-waves, indicating a pause or consolidation before a return to the trend.
Position
The position within the structure is "blue wave 1," indicating that the current corrective pattern (red wave 2) is part of a larger wave cycle. This suggests that the broader trend, represented by blue wave 1, is experiencing a temporary consolidation phase.
Direction for the Next Higher Degrees
The direction for the next higher degrees is "red wave 3," indicating that once the corrective phase is completed, the market is expected to resume its impulsive trend, likely leading to further upward movement.
Details
The details section notes that "red wave 2" is in play, indicating that the corrective phase is ongoing and appears to be approaching its end. The Wave Cancel invalid level is set at 1.22954, suggesting that if the market price falls below this level, the current wave structure may be invalidated, signaling a potential shift in trend.
In summary, the GBP/USD Elliott Wave Analysis for the 4-Hour Chart suggests that the market is currently in a corrective phase (red wave 2) within a broader trend (blue wave 1). The corrective structure appears to be approaching its conclusion, with the next impulsive phase (red wave 3) expected to start soon. The Wave Cancel invalid level at 1.22957 serves as a crucial benchmark, indicating that if the price drops below this level, the corrective structure may be invalidated, requiring a reassessment of the wave pattern and the broader market trend.
Technical Analyst: Malik Awais
Source: visit Tradinglounge.com and learn From the Experts Join TradingLounge Here
See Previous: U.S. Dollar/Japanese Yen (USDJPY)
Special Trial Offer - 0.76 Cents a Day for 3 Months! Click here
Access 6 Analysts covering over 150 Markets. Chat Room With Support