27Jan

AXIS BANK LTD. Elliott Wave Analysis: Share Price Forecast, Technical Trends, and Key Support & Resistance Levels

AXIS BANK LTD Elliott Wave Analysis - TradingLounge (1D Chart)

AXISBANK Elliott Wave Technical Analysis

Function: Counter Trend (Minor Degree, Grey Wave A Unfolding)

Mode: Corrective

Structure: Potential Impulse within Larger Degree Correction

Position: Minute Wave ((iii)) Navy

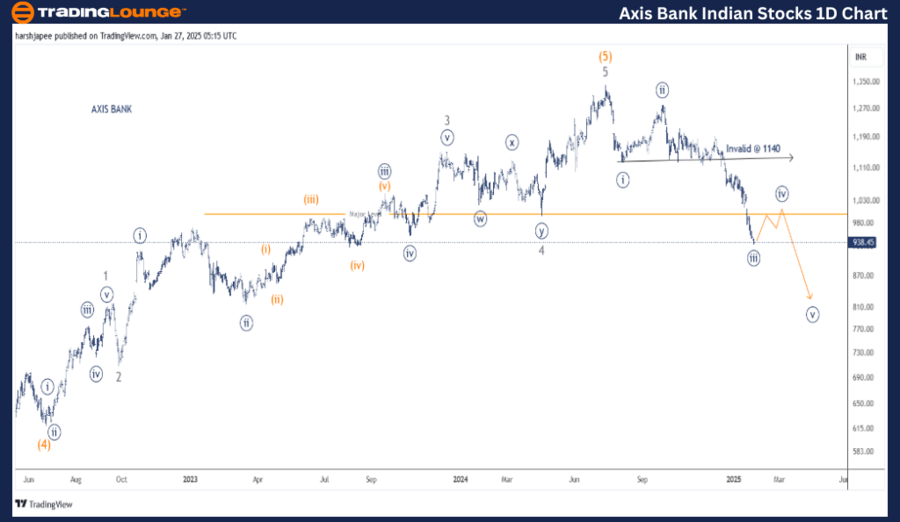
Details: Minute Wave ((iii)) Navy is advancing towards the 900-920 range, with a key resistance level at 1290.

Invalidation Point: 1140 (Risk Tightened)

Daily Chart Analysis and Elliott Wave Counts

The daily chart of AXIS BANK LTD indicates that a larger corrective wave is in progress after hitting the Intermediate Wave (5) Orange peak at around 1340 in July 2024. The price action suggests a minor degree A-B-C corrective pattern, with Minor Wave A potentially evolving as an impulse.

Key observations:

  • Intermediate Wave (4) Orange concluded around the 620 level in June 2022.
  • The rally following this low has been subdivided into five distinct Minor Degree waves (Waves 1 through 5).
  • If this Elliott Wave count holds, AXIS BANK has possibly formed a major market top at the 1340 level.

AXIS-BANK-LTD-1d-sto...


AXIS BANK LTD Elliott Wave Analysis - TradingLounge (4H Chart)

AXISBANK Elliott Wave Technical Analysis

Function: Counter Trend (Minor Degree, Grey Wave A Unfolding)

Mode: Corrective

Structure: Potential Impulse within Larger Degree Correction

Position: Minute Wave ((iii)) Navy

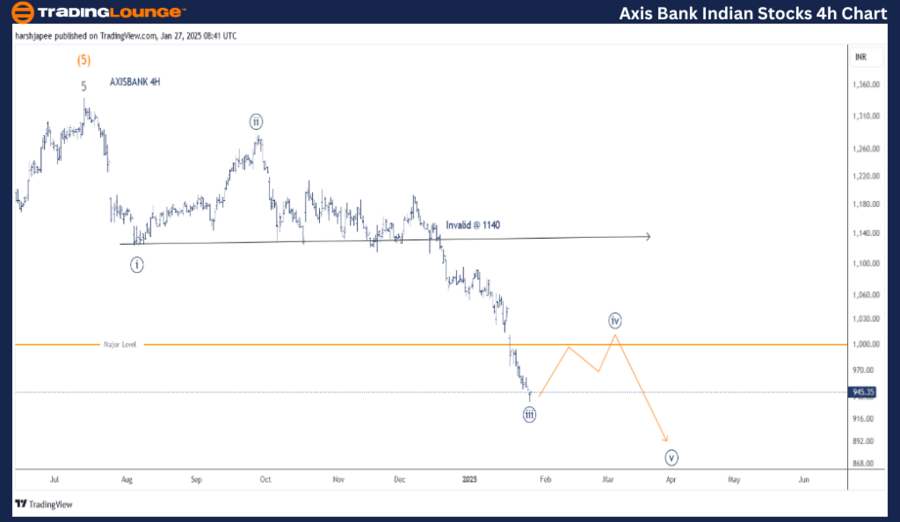
Details: Minute Wave ((iii)) Navy is progressing towards the 900-920 range, with resistance at 1290. The wave might have terminated around the 930-935 region.

Invalidation Point: 1140 (Risk Tightened)

4H Chart Analysis and Elliott Wave Counts

The 4-hour chart of AXIS BANK LTD reveals detailed sub-wave formations following the 1339 peak in July 2024. The unfolding impulse wave at the Minute Degree level showcases the following key movements:

  • Wave ((i)) finalized at 1140
  • Wave ((ii)) retraced up to 1280
  • Wave ((iii)) likely ended around the 935 zone

If the current Elliott Wave count proves accurate, the price may see an upward correction towards the 1030-1040 range, marking the completion of Wave ((iv)), before another decline resumes to complete the impulse sequence. It is crucial that prices remain under the invalidation point of 1140 to sustain the current wave structure.

Technical Analyst: Harsh Japee

Source: visit Tradinglounge.com and learn From the Experts Join TradingLounge Here 

Previous: JSW STEEL Elliott Wave Technical Analysis

VALUE Offer - Buy 1 Month & Get 3 Months!Click here

Access 7 Analysts Over 200 Markets Covered. Chat Room With Support

AXIS-BANK-LTD-4h-sto...


Conclusion

AXIS BANK LTD is projected to approach the 1140 level to finalize the potential Minute Wave ((iv)), followed by a continuation of the downward movement. Traders should monitor resistance levels and invalidation points to gauge further price action effectively.

Related

VeChian Crypto Trading Strategy: Focusing on VeChain's Price Prediction and VETUSD Elliott Wave Technical Analysis

VeChian Crypto Trading Strategy: Focusing on VeChain's Price Prediction and VETUSD Elliott Wave Technical Analysis

This article provides a comprehensive VETUSD Elliott Wave analysis, focusing on VeChain's price ...

Read More >
Price Action Wheat Elliott Wave Analysis: Technical insights, forecasts, and trading opportunitie

Price Action Wheat Elliott Wave Analysis: Technical insights, forecasts, and trading opportunitie

Delve into the captivating world of wheat price analysis through Elliott wave theory. This article p...

Read More >
NextEra Energy Inc.(NEE) Stocks Elliott Wave Technical Analysis: Covers Stock Predictions, Technical insights, And wave pattern analysis

NextEra Energy Inc.(NEE) Stocks Elliott Wave Technical Analysis: Covers Stock Predictions, Technical insights, And wave pattern analysis

This article provides an in-depth Elliott Wave analysis of NextEra Energy Inc. (NEE) on both daily a...

Read More >
XOM Elliott Wave Analysis: Technical Insights on Exxon Mobil Corp. - 5 February 24

XOM Elliott Wave Analysis: Technical Insights on Exxon Mobil Corp. - 5 February 24

This Elliott Wave analysis of Exxon Mobil Corp. (XOM) on both daily and 4-hour charts provides valua...

Read More >
KOSPI Composite Index Elliott Wave Technical Analysis: Understanding market behaviour and effective trading strategies

KOSPI Composite Index Elliott Wave Technical Analysis: Understanding market behaviour and effective trading strategies

The KOSPI Composite analysis provides insights using Elliott Wave Theory, detailing both day and wee...

Read More >

Buy 1 Month

Get 3 Months!

Special Offer:

Trade Recommendations

Unleash the power of deversified trading with our comprehensive portfolio, covering:

  • Stock Trades
  • Crypto Trades
  • Forex Trades
  • Commodity Trades
Elliott Wave Analysis

Gain a competive edge with expert insights in to:

  • Global Indices
  • US Stocks & ASX Stocks
  • Forex & Crypto
  • Commodities
Top-Notch Trading Tools

Equip yourself with the tools of success:

  • Social Chat
  • Elliott Wave Algorithm
  • Screener
  • TradingLevels
  • Trading Game
7 Elliott Wave Analysts

Stay ahead of the market with daily charts and insightful videos
-Your secret to strategic trading!

JOIN HERE


Welcome to TradingLounge (ASIC A.R.No. 321187), specialists in trades, trading education and technical analysis, covering stocks, indices, commodities, forex and cryptocurrencies.

When you join TradingLounge you have access to everything we offer, including trade tools, educational content and a social platform to chat with like-minded investors.

Read more

@Copyright 2024 by tradinglounge.com

Contact Us

Australian no: 02 4787 6020

International no: +61 (2) 47876020

Pay with:

Find us on