21May

Nestle India Share Price Outlook: NESTLEIND Elliott Wave Analysis Signals Strong Bullish Trend with Key Levels and Forecast

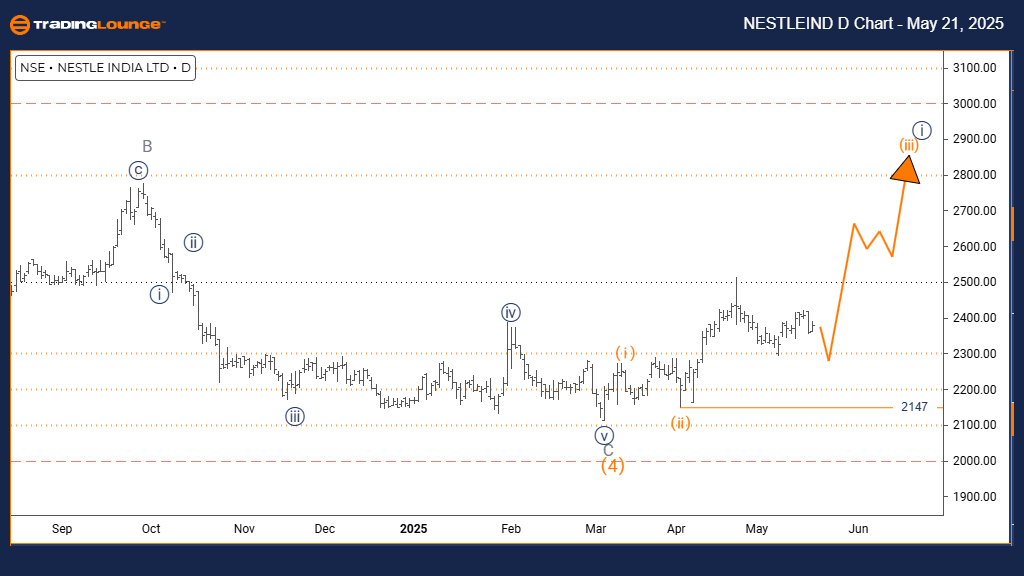
NESTLE INDIA Elliott Wave Analysis | Trading Lounge Day Chart

NESTLE INDIA Stock Day Chart Analysis

NESTLE INDIA Elliott Wave Technical Analysis

FUNCTION: Bullish Trend

MODE: Impulsive

STRUCTURE: Orange wave 3

POSITION: Navy blue wave 1

DIRECTION NEXT HIGHER DEGREES: Orange wave 3 (in progress)

DETAILS: Completion of orange wave 2 is likely; orange wave 3 of 1 appears to be unfolding.

Invalidation Level: 4147

The daily Elliott Wave analysis for Nestle India stock shows a bullish setup, driven by the development of orange wave 3 inside navy blue wave 1. The earlier phase, orange wave 2, has seemingly concluded, allowing the next impulsive move upward to start. This typically signifies a strong rally within the wave count.

The internal structure indicates robust buying activity, suggesting momentum will likely persist. Given its position in navy blue wave 1, the strength of this impulsive wave supports continued bullish behavior. The key invalidation point remains at 4147—any drop below that would challenge the current wave scenario.

This chart setup underlines a positive phase for Nestle India. If the wave count holds, the stock may move into a sustained upward trend. Traders should remain alert to bullish confirmations and be cautious of upcoming corrective actions post this impulse phase.

NESTLEIND-Indian-Sto...


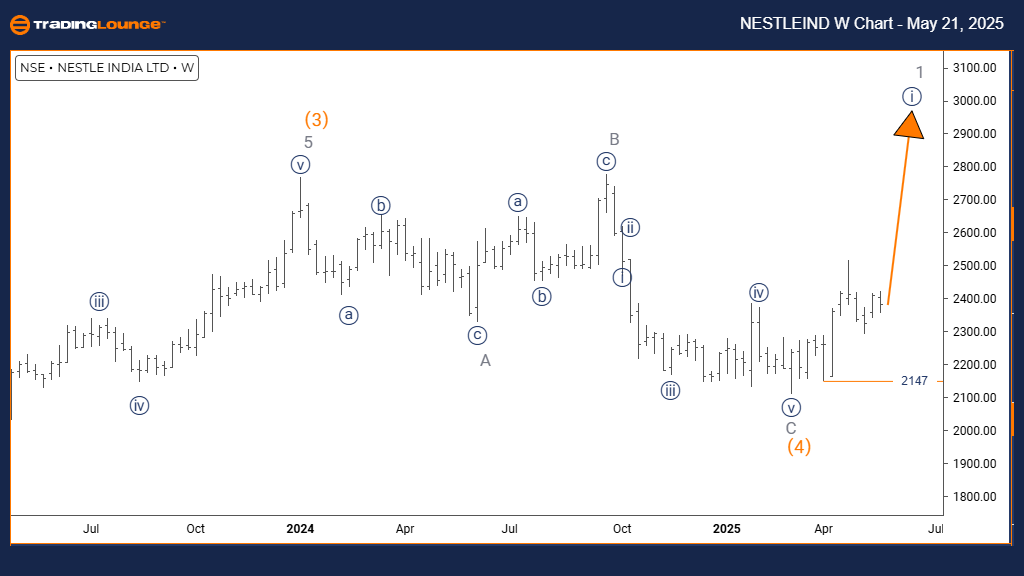
NESTLE INDIA Elliott Wave Analysis | Trading Lounge Weekly Chart

NESTLE INDIA Elliott Wave Technical Analysis

FUNCTION: Bullish Trend

MODE: Impulsive

STRUCTURE: Navy blue wave 1

POSITION: Gray wave 1

DIRECTION NEXT LOWER DEGREES: Navy blue wave 2

DETAILS: Orange wave 4 seems completed; navy blue wave 1 within gray wave 1 is advancing.

Invalidation Level: 4147

On the weekly timeframe, Nestle India continues to exhibit long-term bullish momentum. The current wave structure supports navy blue wave 1 developing inside gray wave 1, following the likely end of orange wave 4. This configuration points to the early stage of a broad upward cycle.

The impulsive behavior signals underlying strength, likely fueled by sustained buying from institutional investors. The level at 4147 acts as a crucial invalidation benchmark; breaching it would call for a reassessment of the wave count.

This scenario supports a long-term bullish outlook. The present wave 1 may precede a brief corrective move as navy blue wave 2 develops. Monitoring the price closely will be essential for confirming wave progression and managing downside risks near the invalidation level.

Technical Analyst: Malik Awais

Source: Visit Tradinglounge.com and learn from the Experts. Join TradingLounge Here 

Previous: HDFC BANK Elliott Wave Technical Analysis

VALUE Offer - Buy 1 Month & Get 3 Months!Click here

Access 7 Analysts Over 200 Markets Covered. Chat Room With Support

NESTLEIND-Indian-Sto...

Related

USDCHF Elliott Wave Technical Analysis: Uncover Key Market Moves for Smarter Forex Trading Decisions

USDCHF Elliott Wave Technical Analysis: Uncover Key Market Moves for Smarter Forex Trading Decisions

This USDCHF Elliott Wave analysis provides an in-depth look at the current market structure, identif...

Read More >
Spotify Technology S.A. (SPOT) Stocks Elliott Wave Technical Analysis includes Trading Strategy and Market Trends

Spotify Technology S.A. (SPOT) Stocks Elliott Wave Technical Analysis includes Trading Strategy and Market Trends

This article provides an in-depth Elliott Wave analysis of Spotify Technology S.A. (SPOT), covering ...

Read More >
Elliott Wave Analysis for NASDAQ Tech Stocks and SP500: Navigating the Correction Phase

Elliott Wave Analysis for NASDAQ Tech Stocks and SP500: Navigating the Correction Phase

NASDAQ 100 (NDX) and SP500 (SPX) are currently in an intermediate or primary wave four, marking the ...

Read More >
Coffee Commodity Elliott Wave Technical Analysis: A Deep Dive into the Current Market Trends

Coffee Commodity Elliott Wave Technical Analysis: A Deep Dive into the Current Market Trends

Elliott Wave analysis of coffee prices, highlighting the current market trends and future predictio...

Read More >
Unlocking ASX Trading Success: REECE LIMITED - REH Stock Analysis & Elliott Wave Technical Forecast

Unlocking ASX Trading Success: REECE LIMITED - REH Stock Analysis & Elliott Wave Technical Forecast

This article provides an in-depth Elliott Wave technical analysis of Reece Limited (ASX: REH), offer...

Read More >
Elliott Wave Analysis: S&P 500, NASDAQ 100, DAX 40, FTSE 100 & ASX 200 – Key Market Trends & Trade Setups

Elliott Wave Analysis: S&P 500, NASDAQ 100, DAX 40, FTSE 100 & ASX 200 – Key Market Trends & Trade Setups

Elliott Wave Market Outlook & Trading Strategy The S&P 500 (SPX) and NASDAQ 100 (NDX) are in an A-B...

Read More >

Buy 1 Month

Get 3 Months!

Special Offer:

Trade Recommendations

Unleash the power of deversified trading with our comprehensive portfolio, covering:

  • Stock Trades
  • Crypto Trades
  • Forex Trades
  • Commodity Trades
Elliott Wave Analysis

Gain a competive edge with expert insights in to:

  • Global Indices
  • US Stocks & ASX Stocks
  • Forex & Crypto
  • Commodities
Top-Notch Trading Tools

Equip yourself with the tools of success:

  • Social Chat
  • Elliott Wave Algorithm
  • Screener
  • TradingLevels
  • Trading Game
7 Elliott Wave Analysts

Stay ahead of the market with daily charts and insightful videos
-Your secret to strategic trading!

JOIN HERE


Welcome to TradingLounge (ASIC A.R.No. 321187), specialists in trades, trading education and technical analysis, covering stocks, indices, commodities, forex and cryptocurrencies.

When you join TradingLounge you have access to everything we offer, including trade tools, educational content and a social platform to chat with like-minded investors.

Read more

@Copyright 2024 by tradinglounge.com

Contact Us

Australian no: 02 4787 6020

International no: +61 (2) 47876020

Pay with:

Find us on