HDFC BANK Elliott Wave Analysis | Trading Lounge Daily Chart
HDFC BANK Elliott Wave Technical Analysis
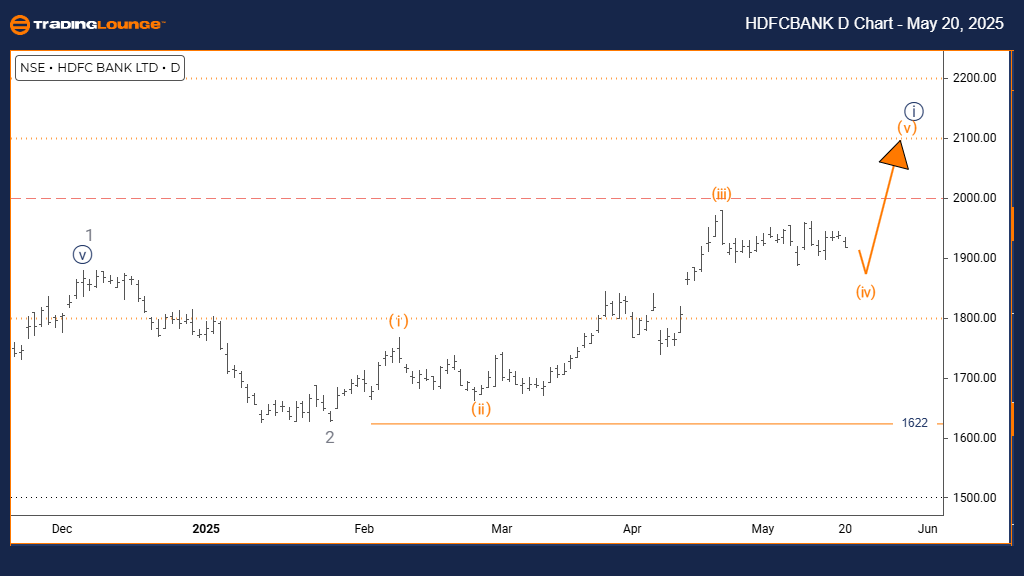
FUNCTION: Counter Trend
MODE: Corrective
STRUCTURE: Orange Wave 4
POSITION: Navy Blue Wave 1
DIRECTION NEXT HIGHER DEGREES: Orange Wave 5
DETAILS: Orange Wave 3 appears complete. Market action now suggests development of either Orange Wave 4 or Navy Blue Wave 1.
Wave Cancel Invalid Level: 1622
The daily Elliott Wave analysis for HDFC Bank signals a counter-trend phase within a broader corrective market structure. Current price behavior indicates progression in orange wave four, possibly transitioning into a new impulsive phase as navy blue wave one. The completion of orange wave three supports this outlook and implies short-term recovery or a fresh downtrend initiation.
At this juncture, HDFC Bank's price structure points to unfolding action in either wave four or wave one. The critical invalidation level at 1622 acts as a reference for trend reassessment. A close above this point would question the current wave sequence and may indicate a deeper corrective expansion. As the market remains within a corrective framework, sustained upside appears limited unless clear signals confirm a shift to a bullish trend.
This technical analysis offers key insights for short-term trading strategies. Until wave four confirms its termination or navy blue wave one is validated, expect heightened volatility. Close monitoring of price action, especially near the 1622 invalidation level, is essential for effective risk management and to anticipate the next move in the trend.
Traders should maintain a cautious stance while navigating this complex counter-trend structure. Though minor bullish attempts could emerge, the prevailing sentiment stays negative unless technical criteria significantly alter the current bearish bias.
HDFC BANK Elliott Wave Analysis | Trading Lounge Weekly Chart
HDFC BANK Elliott Wave Technical Analysis
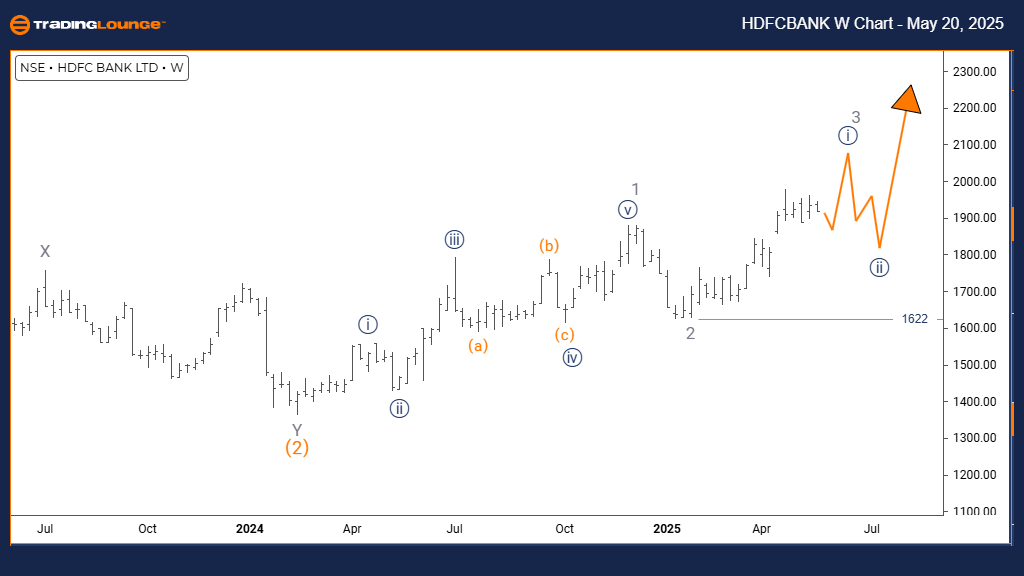
FUNCTION: Bullish Trend
MODE: Impulsive
STRUCTURE: Navy Blue Wave 1
POSITION: Gray Wave 3
DIRECTION NEXT LOWER DEGREES: Navy Blue Wave 2
DETAILS: Gray Wave 2 is likely complete. Navy Blue Wave 1 of 3 is now advancing.
Wave Cancel Invalid Level: 1622
The weekly Elliott Wave forecast for HDFC Bank reflects a robust bullish trend driven by an impulsive wave pattern. The market is now forming navy blue wave one, unfolding within the broader ascending structure of gray wave three. Completion of gray wave two suggests a transition to the next upward movement, initiating wave one of three.
Momentum remains strong, and technical indicators support the bullish stance as gray wave two finalizes. The 1622 level serves as the crucial wave invalidation point; a decline below this would trigger a re-evaluation of the current bullish projection. This impulsive structure underscores significant buying interest, and positioning within wave three signals potential for extended gains.
Once the current upward wave finalizes, a corrective navy blue wave two is expected. This aligns with Elliott Wave principles, projecting a temporary pullback before resuming the larger uptrend. The 1622 mark remains a key support level to maintain the bullish thesis.
Overall, HDFC Bank's weekly chart indicates strong upside potential while still acknowledging the likelihood of interim corrections. Traders and investors should monitor momentum sustainability and prepare for corrective phases, especially as wave one matures.
Technical Analyst: Malik Awais
Source: Visit Tradinglounge.com and learn from the Experts. Join TradingLounge Here
Previous: ASIAN PAINT Elliott Wave Technical Analysis
VALUE Offer - Buy 1 Month & Get 3 Months!Click here
Access 7 Analysts Over 200 Markets Covered. Chat Room With Support
Exclusive TradingLounge Offer: $1 Two-Week Trial, then $29 Per Month - 58% Discount NOW
Access 8 analysts, 250+ markets, real-time chat rooms, AI-powered Elliott Wave charting, and portfolio tools.
Claim This Deal Now