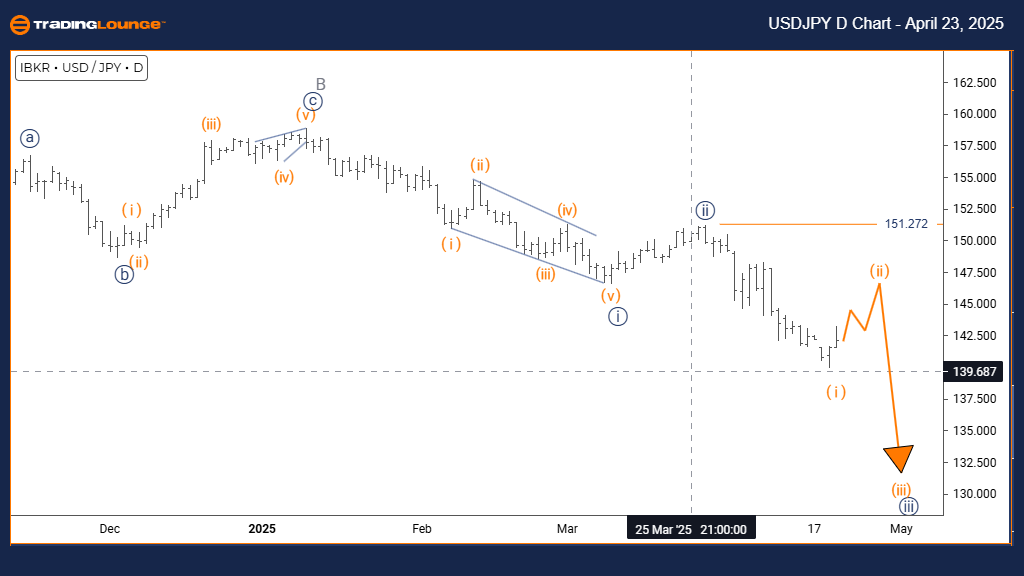
USDJPY Elliott Wave Analysis – Trading Lounge Daily Chart
U.S. Dollar / Japanese Yen (USDJPY) – Daily Chart
USDJPY Elliott Wave Technical Analysis
Function: Counter Trend
Mode: Corrective
Structure: Orange wave 2
Position: Navy blue wave 3
Direction Next Lower Degrees: Orange wave 3
Details: Orange wave 1 appears complete, with orange wave 2 now unfolding.
Wave Cancel Invalid Level: 151.272
The USDJPY daily chart presents a corrective wave structure, forming within a dominant bullish trend. The completion of orange wave 1’s upward impulse suggests the start of orange wave 2’s retracement phase, nested inside the broader navy blue wave 3 uptrend. This sets the stage for a potential short-term pullback before the next bullish continuation.
Typically, orange wave 2 retraces between 38.2% and 61.8% of wave 1’s movement and is characterized by choppy, overlapping price action with declining momentum—hallmarks of a classic corrective wave. On this daily timeframe, the correction may signal a mid-term pause before the resumption of the bullish trend.
Traders should anticipate a strong move higher with the development of orange wave 3, which often surpasses wave 1’s high. The invalidation level at 151.272 is critical—any price action below this would negate the current wave structure. Watch for bullish reversal patterns and oversold technical indicators to confirm wave 2’s completion and wave 3’s initiation.
This retracement is a natural and healthy consolidation phase in the broader uptrend. Fibonacci retracement levels can serve as key areas for identifying high-probability trade setups as the market transitions into the next impulsive wave.
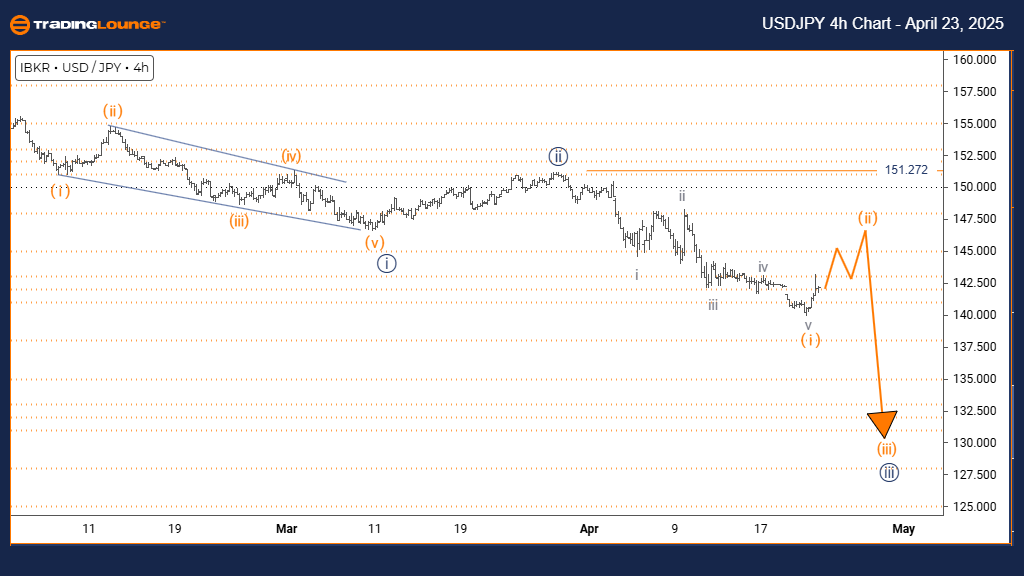
U.S. Dollar / Japanese Yen (USDJPY) – Tradinglounge 4 Hour Chart
USDJPY Elliott Wave Technical Analysis
Function: Counter Trend
Mode: Corrective
Structure: Orange wave 2
Position: Navy blue wave 3
Direction Next Lower Degrees: Orange wave 3
Details: Orange wave 1 looks completed, and orange wave 2 is now developing.
Wave Cancel Invalid Level: 151.272
The USDJPY 4-hour chart underscores a corrective wave pattern emerging within a dominant uptrend. Orange wave 1’s upward leg appears complete, with orange wave 2 now unfolding as a short-term correction within navy blue wave 3. This structure implies a brief pullback before the trend potentially resumes.
Wave 2 corrections usually retrace 38.2% to 61.8% of wave 1’s advance and exhibit overlapping price action with reduced momentum—typical features of an Elliott corrective phase. This consolidation phase is key to the overall pattern and may soon give way to a new impulsive move.
Once complete, orange wave 3 is expected to initiate a strong bullish move, often extending beyond wave 1’s high. The 151.272 level serves as a key invalidation point—dropping below it would break the current Elliott Wave count. Traders should monitor for bullish candlestick formations and support at Fibonacci retracement zones to signal the end of wave 2.
This corrective phase is part of a broader trending structure, providing traders with strategic opportunities to plan for the next bullish breakout. Using Fibonacci levels can help pinpoint ideal entry points as the transition from correction to impulse unfolds.
Technical Analyst: Malik Awais
Source: Visit Tradinglounge.com and learn from the Experts. Join TradingLounge Here
Previous: AUDUSD Elliott Wave Technical Analysis
VALUE Offer - Buy 1 Month & Get 3 Months!Click here
Access 7 Analysts Over 200 Markets Covered. Chat Room With Support