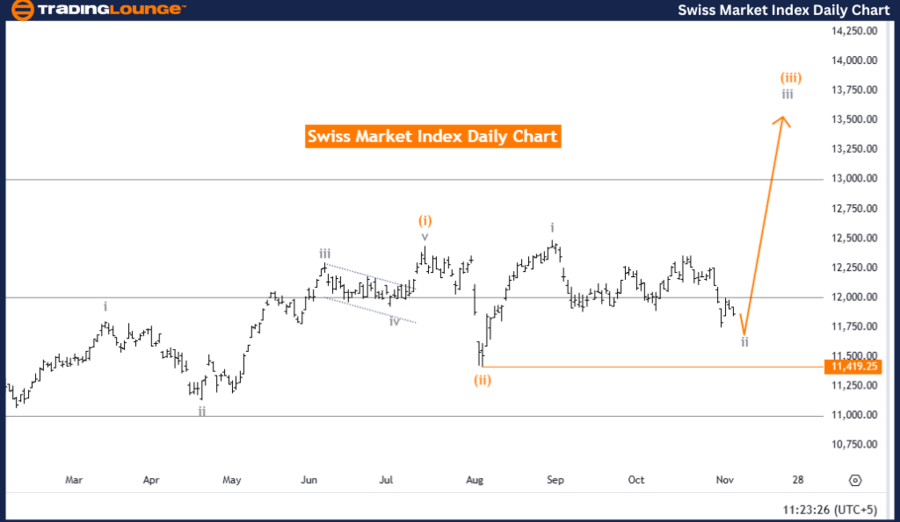
Swiss Market Index (SMI) Day Chart Analysis
SMI Elliott Wave Technical Analysis - Day Chart
Index: Swiss Market Index (SMI)
Chart Focus: Elliott Wave Technical Analysis
Function: Counter Trend
Mode: Corrective
Wave Structure: Gray Wave 2
Position: Within Orange Wave 3
Direction for Next Higher Degree: Transition to Gray Wave 3
Details: Gray Wave 1 has completed, and Gray Wave 2 is nearing its end.
Current SMI Elliott Wave Overview
The Swiss Market Index (SMI) day chart analysis highlights a counter-trend correction currently in gray wave 2, marking a phase of consolidation following the completion of gray wave 1. Positioned within orange wave 3, the corrective movement in gray wave 2 is expected to be nearing its conclusion, paving the way for an anticipated shift to gray wave 3, which would indicate a higher-degree bullish trend.
Gray wave 2 serves as a corrective phase after the initial bullish movement of gray wave 1 and is now close to completion. This phase hints at a potential transition back toward an upward trend, likely beginning with gray wave 3. The wave invalidation level is established at 11,419.25, marking a critical threshold; any downward movement below this point would negate the current corrective structure and suggest a possible deviation from the anticipated trend continuation.
Key Levels and Immediate Trend Focus
The primary focus remains on the anticipated end of gray wave 2, which could signal a transition into gray wave 3 and resume upward movement. Traders should watch closely for signals near the invalidation level of 11,419.25, as maintaining above this level is essential for supporting the bullish outlook.
Summary
In conclusion, the SMI is presently in a corrective phase within gray wave 2, following the completion of gray wave 1. The next significant wave is projected to be gray wave 3, indicating a possible return to bullish momentum. The critical invalidation level at 11,419.25 will be crucial to monitor; any breach could nullify the current wave structure and hint at a trend shift. Market participants are watching for the conclusion of gray wave 2, expecting a resurgence in the upward trend if the corrective structure holds.
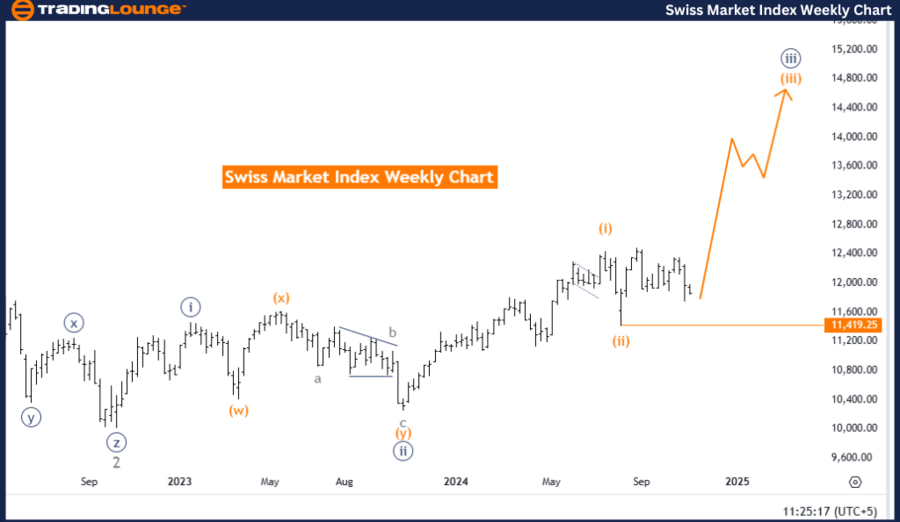
Swiss Market Index (SMI) Weekly Chart Analysis
Elliott Wave Analysis for SMI - Weekly Chart
Index: Swiss Market Index (SMI)
Chart Focus: Elliott Wave Technical Analysis
Function: Bullish Trend
Mode: Impulsive
Wave Structure: Orange Wave 3
Position: Within Navy Blue Wave 3
Direction for Next Higher Degree: Ongoing Orange Wave 3
Details: Orange Wave 2 has completed, and Orange Wave 3 is currently advancing.
Current SMI Elliott Wave Overview
The weekly chart analysis of the Swiss Market Index showcases a bullish trend in an impulsive mode, focusing on orange wave 3 following the completion of orange wave 2. The ongoing upward momentum in orange wave 3 aligns with navy blue wave 3, reinforcing a strong bullish outlook for the SMI.
This phase in orange wave 3 implies continued upward momentum, aligning with the larger bullish trend. With orange wave 2 finalized, the SMI is projected to sustain its advance in the impulsive phase of orange wave 3, indicating a robust positive trend consistent with higher-degree wave analysis. The invalidation level at 11,419.25 remains a critical point to observe; a move below this threshold would invalidate the current wave structure, suggesting a potential shift from the bullish trend.
Key Levels and Immediate Trend Focus
With orange wave 3 in progress, investors may focus on signs of continued bullish momentum. Staying above the invalidation level of 11,419.25 supports the bullish framework and indicates potential for further gains within navy blue wave 3.
Summary
In summary, the SMI is progressing within the impulsive phase of orange wave 3, following the completion of orange wave 2. The continuity of this bullish trend hinges on maintaining levels above the 11,419.25 invalidation level. The analysis maintains a positive outlook, anticipating further upward movement as the SMI advances within the current bullish structure.
Technical Analyst: Malik Awais
Source: visit Tradinglounge.com and learn From the Experts Join TradingLounge Here
Previous: KOSPI Composite Elliott Wave Technical Analysis
VALUE Offer - Buy 1 Month & Get 3 Months!Click here
Access 7 Analysts Over 200 Markets Covered. Chat Room With Support