KOSPI Composite Elliott Wave Analysis - Daily Chart
KOSPI Composite Elliott Wave Technical Analysis
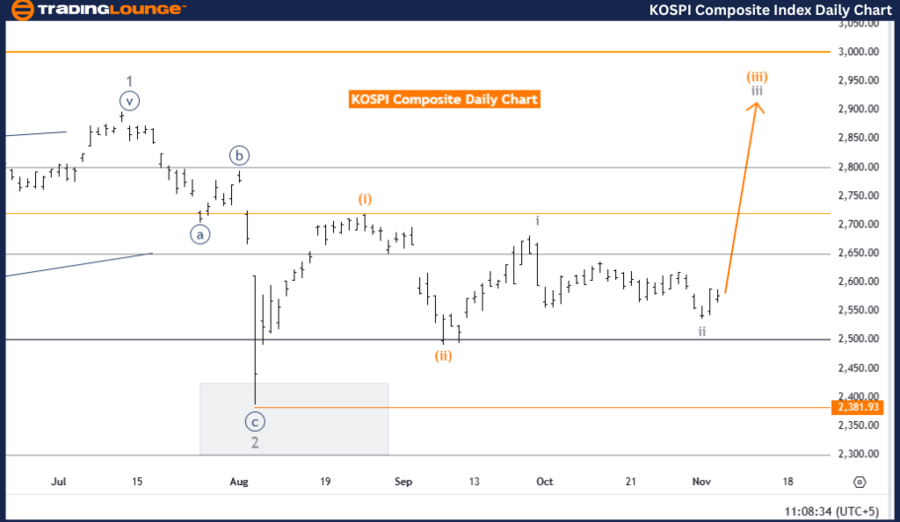
Trend: Bullish
Mode: Impulsive
Current Structure: Gray wave 3
Position: Orange wave 3
Next Higher Degree: Gray wave 3 (initiated)
Wave Cancel Invalid Level: 2381.93
Analysis Overview
The daily Elliott Wave analysis of the KOSPI Composite reflects a bullish trend in an impulsive phase, with the index progressing within gray wave 3. This wave signals a robust upward movement within a broader bullish structure. With gray wave 2 now completed, gray wave 3 has commenced, highlighting renewed upward momentum. Typically, gray wave 3 represents the most dynamic stage of an impulsive wave, often bringing substantial price gains over the short term.
Current Position: Orange Wave 3
At present, the KOSPI Composite is positioned within orange wave 3, a phase associated with accelerated growth. This placement suggests a favorable position for continued gains, reinforcing the overall bullish trend. The progress of gray wave 3 lends further support to this view, with signals of a steady upward path as long as the wave structure remains intact.
Wave Cancel Invalid Level
A critical invalidation threshold is set at 2381.93. Any drop in price below this level would invalidate the current wave pattern, indicating a possible shift away from the bullish trend. However, as long as the price stays above this level, the bullish outlook remains robust, with gray wave 3 expected to push higher.
Summary
The KOSPI Composite is in a bullish, impulsive phase, with gray wave 3 currently active. If the price maintains above the 2381.93 invalidation point, the upward trend is expected to continue, with orange wave 3 likely fueling additional gains. This analysis supports the view that market strength will persist within the Elliott Wave structure, with prospects for sustained growth.
KOSPI Composite Elliott Wave Analysis - Weekly Chart
KOSPI Composite Elliott Wave Technical Analysis
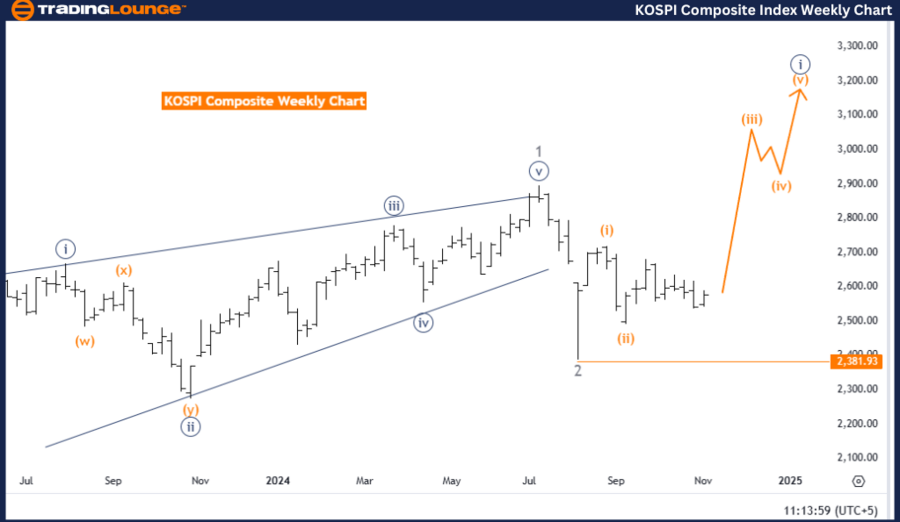
Trend: Bullish
Mode: Impulsive
Current Structure: Orange wave 3
Position: Navy blue wave 1
Next Higher Degree: Orange wave 3 (initiated)
Wave Cancel Invalid Level: 2381.93
Analysis Overview
The weekly Elliott Wave analysis of the KOSPI Composite shows a bullish trend in an impulsive mode within orange wave 3, suggesting ongoing upward momentum. Having completed orange wave 2, the index has now entered orange wave 3, a stage typically marked by notable market advances. This shift indicates that the KOSPI Composite is positioned well for potential growth, aligning with the larger bullish forecast.
Current Position: Navy Blue Wave 1
The index is currently within navy blue wave 1, reinforcing the upward movement. As part of orange wave 3, which is known for its strength within impulsive sequences, this positioning suggests continued upward price action. The persistence of this trend within orange wave 3 remains likely, assuming favorable market conditions and stability in the wave structure.
Wave Cancel Invalid Level
A significant support level is placed at 2381.93. Any price drop below this point would invalidate the current wave structure, signaling a potential shift away from the bullish outlook. However, as long as the price holds above this level, the bullish structure is anticipated to stay intact, supporting a continued upward trend.
Summary
The KOSPI Composite is currently in a bullish impulsive wave structure, with the transition to orange wave 3 marking the beginning of a phase typically associated with further growth. If the price remains above the invalidation level of 2381.93, the index is likely to continue its upward movement, with additional gains expected as the bullish wave structure advances.
Technical Analyst: Malik Awais
Source: visit Tradinglounge.com and learn From the Experts Join TradingLounge Here
Previous: DOW JONES - DJI Elliott Wave Technical Analysis
VALUE Offer - Buy 1 Month & Get 3 Months!Click here
Access 7 Analysts Over 200 Markets Covered. Chat Room With Support