DOW JONES - DJI Elliott Wave Analysis Trading Lounge Day Chart
DOW JONES - DJI Elliott Wave Technical Analysis
Function: Counter Trend
Mode: Corrective
Structure: Orange Wave 2
Position: Navy Blue Wave 5
Next Higher Degree Direction: Orange Wave 3
Analysis Details:
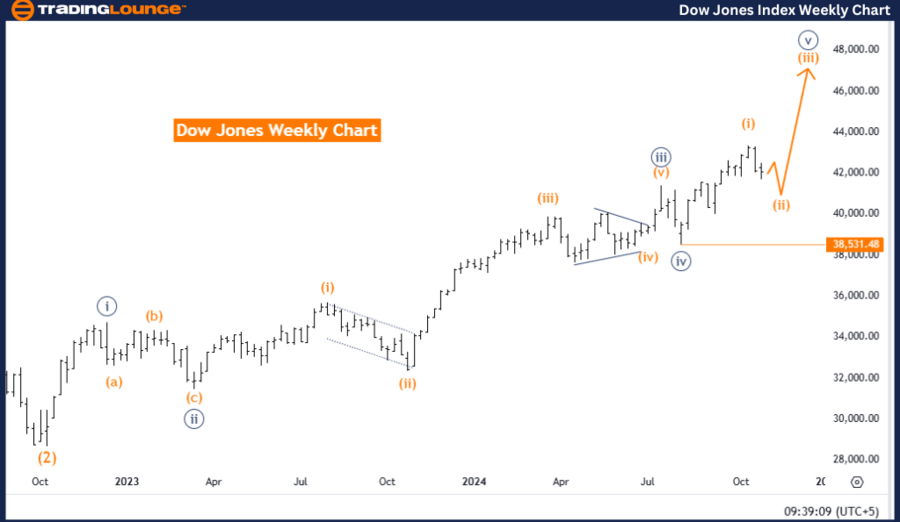
The Dow Jones (DJI) daily chart’s Elliott Wave analysis shows a counter-trend movement, representing a corrective wave phase. This current stage is identified as Orange Wave 2, signifying a corrective step following the preceding impulsive Orange Wave 1. Positioned within Navy Blue Wave 5, this phase indicates that Wave 2 is in motion, marking a consolidation period or minor retracement within the larger upward trend.
The projected next phase, Orange Wave 3, is expected to continue the primary upward trend upon the completion of Orange Wave 2. In line with Elliott Wave Theory, these corrective stages, like Orange Wave 2, serve as temporary pullbacks or consolidation phases, setting up a foundation before resuming the main trend direction.
A critical invalidation level has been set at 38,531.48. If the price drops below this threshold, it would invalidate the current wave structure and could suggest a potential shift in the corrective pattern. However, as long as the price remains above this level, the current wave count remains valid, projecting a likely continuation into Orange Wave 3 once Orange Wave 2 concludes.
This analysis implies that the primary trend should resume upward after Orange Wave 2’s completion, aligning with the anticipated move into Orange Wave 3. The current wave count supports a bullish outlook beyond this corrective phase, contingent on the invalidation level holding firm. This structure suggests a temporary pause, after which the market may continue its upward movement, completing the transition into the impulsive structure anticipated with Orange Wave 3.
DOW JONES - DJI Elliott Wave Analysis Trading Lounge Weekly Chart
DOW JONES - DJI Elliott Wave Technical Analysis
Function: Counter Trend
Mode: Corrective
Structure: Orange Wave 2
Position: Navy Blue Wave 5
Next Higher Degree Direction: Orange Wave 3
Analysis Details:
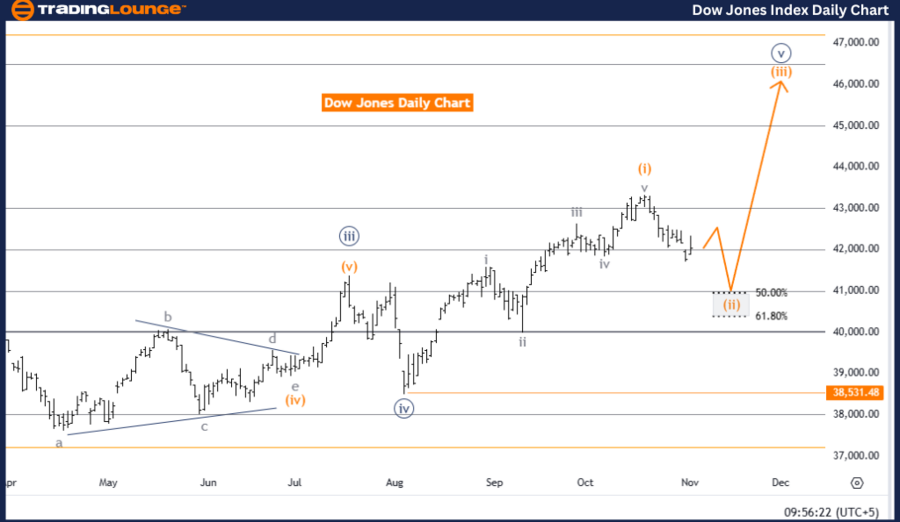
On the weekly chart, the Dow Jones (DJI) Elliott Wave analysis highlights a counter-trend corrective phase within Orange Wave 2. This stage follows the conclusion of Orange Wave 1, indicating a temporary retracement within the broader upward trend. Positioned within Navy Blue Wave 5, this wave signals that Orange Wave 2 is currently active, reflecting a corrective action within the larger trend.
Upon the completion of Orange Wave 2, expectations are for the index to progress into Orange Wave 3, resuming its primary bullish direction. This anticipated transition into Wave 3 suggests an upward movement post the corrective retracement of Wave 2. In Elliott Wave Theory, corrective waves, such as Orange Wave 2, typically act as consolidation phases, allowing the market to stabilize and gather momentum before resuming its advance.
The invalidation level for this wave count is set at 38,531.48. Should prices fall below this mark, the current wave count would be invalidated, potentially signaling a change in the expected pattern. However, if prices stay above this level, the structure aligns with the forecast of a continuation into Orange Wave 3 following Orange Wave 2's conclusion. This invalidation level serves as a crucial checkpoint, affirming the validity of the wave count and supporting the projected market direction, while sustaining the expected corrective and impulsive phases.
In summary, this analysis identifies a temporary corrective phase within the broader bullish trend. Orange Wave 2 represents a consolidation before the probable shift into the impulsive Orange Wave 3. This corrective structure allows the market to stabilize before resuming its upward movement, as long as the invalidation level is respected. Overall, the wave setup points to a bullish outlook in the longer term, with the market expected to transition back into the primary trend after completing this correction.
Technical Analyst: Malik Awais
Source: visit Tradinglounge.com and learn From the Experts Join TradingLounge Here
Previous: Bovespa Index Elliott Wave Technical Analysis
VALUE Offer - Buy 1 Month & Get 3 Months!Click here
Access 7 Analysts Over 200 Markets Covered. Chat Room With Support