Introduction to NEO/USD Elliott Wave Analysis
In the dynamic world of cryptocurrency trading, Elliott Wave Analysis stands out as a powerful tool for understanding market trends and making informed decisions. Today, we dive deep into the Elliott Wave Analysis of NEO against the U.S. dollar (NEOUSD), exploring its current position, potential future movements, and trading strategies to capitalize on these insights. This analysis aims to guide traders through the complexities of NEOUSD's market behaviour, highlighting opportunities for profitable trading.
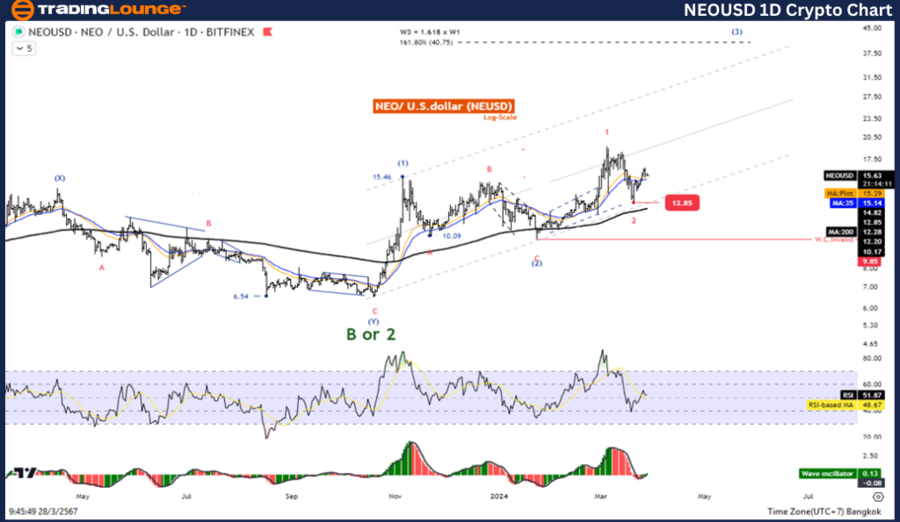
TradingLounge Daily Chart Analysis: NEO/USD in an Uptrend
NEO/ U.S. dollar(NEOUSD) Daily Chart Analysis
NEOUSD Elliott Wave Technical Analysis
NEOUSD Elliott Wave Technical Insights
- Function: Trend Following
- Mode: Motive Phase
- Structure: Impulse Pattern
- Current Position: Wave 3
- Upcoming Movement: Proceeding to Wave 3 of a higher degree
- Invalidation Point: Below $9.85
In-depth Analysis: The ongoing Wave 3 is identified to extend up to 161.8% the length of Wave 1, reaching a target of $24.52. This indicates a robust uptrend, underpinning the strength of NEO's current market phase.
Trading Strategy for NEO/USD:
Given NEO's persistence in the third-wave price structure, we anticipate the price testing the $40.75 mark, equivalent to 161.8% of Wave 1's length. Traders should thus seek opportunities to engage with the uptrend, leveraging the bullish momentum suggested by the price's position above the MA200 and the positive Wave Oscillator readings.
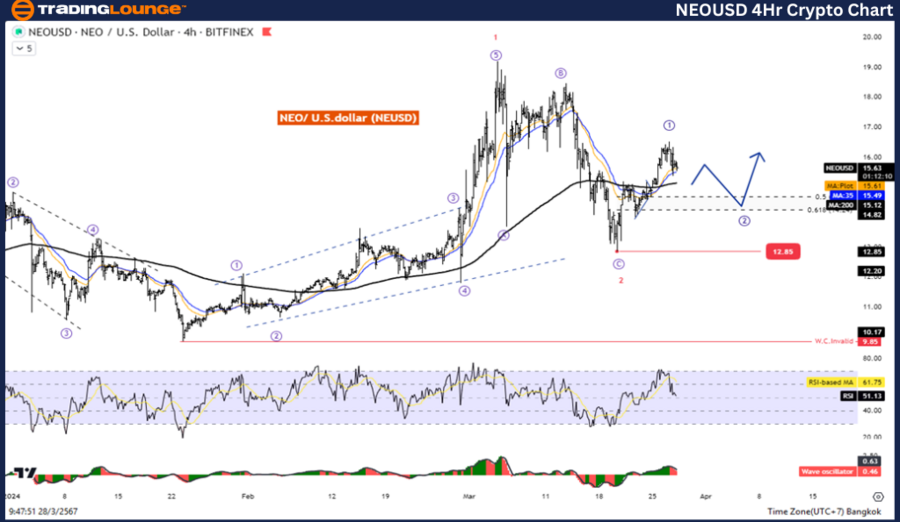
TradingLounge 4-Hour Chart Analysis: NEO/USD's Short-term Dynamics
NEO/ U.S. dollar(NEOUSD) 4H Chart Analysis
NEOUSD Elliott Wave Technical Analysis
Elliott Wave Technical Overview
- Function: Counter-Trend Movement
- Mode: Corrective Phase
- Structure: Zigzag Correction
- Current Position: Wave C
- Next Movement: Transitioning to Wave 2 of a higher degree
- Invalidation Threshold: Below $9.85
Detailed Outlook: The analysis reveals Wave 2 equating to 61.8% of Wave 1 at a pivotal level of $14.24. This setup suggests a temporary pullback, offering a strategic entry point for traders to re-engage with NEO's underlying uptrend.
NEO/USD Trading Considerations:
Even as NEO showcases a strong uptrend, traders should remain vigilant for the short-term retracement to the level of $14.14, marking the completion of the corrective phase before the resumption of the upward trajectory. The maintained position above the MA200 and the bullish momentum indicated by the Wave Oscillator reinforce the optimistic outlook for NEOUSD.
Conclusion: Navigating the NEO/USD Market with Elliott Wave Analysis
Elliott Wave Analysis presents a nuanced perspective on NEOUSD's market movements, offering traders a strategic framework for navigating the volatility inherent in cryptocurrency markets. With the current analysis pointing towards continued growth, punctuated by short-term corrections, traders are equipped to make calculated decisions, aligning with the overarching uptrend and the potential for significant gains. As always, staying attuned to technical indicators and market dynamics is crucial for optimizing trading outcomes.
Technical Analyst: Kittiampon Somboonsod
Source: visit Tradinglounge.com and learn From the Experts Join TradingLounge Here
See Previous: Binance/ U.S. dollar(BNBEUSD)
TradingLounge Once Off SPECIAL DEAL: Here > 1 month Get 3 months.