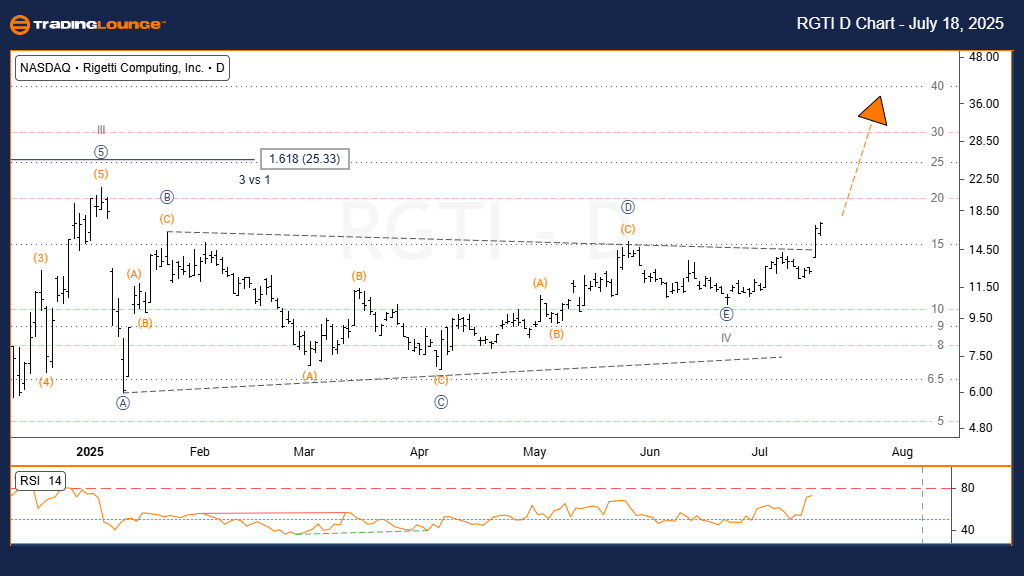
Bovespa Index Elliott Wave Analysis | Trading Lounge Day Chart
Bovespa Index Day Chart Overview
Bovespa Index Elliott Wave Technical Analysis
FUNCTION: Bullish Trend
MODE: Impulsive
STRUCTURE: Gray Wave 3
POSITION: Orange Wave 3
DIRECTION NEXT LOWER DEGREES: Gray Wave 4
DETAILS: Gray Wave 2 has completed; Gray Wave 3 is currently in progress.
Wave Cancel Invalidation Level: 122,486
The Bovespa Index daily Elliott Wave chart shows a clearly defined bullish trend within an impulsive wave structure. The ongoing wave count places Gray Wave 3 inside the broader Orange Wave 3, one of the strongest rally phases under Elliott Wave theory. With Gray Wave 2 finalized, the index has entered a high-momentum impulse phase, presenting substantial upside potential.
This current wave configuration signals a shift from previous consolidation into a sustained upward movement. Gray Wave 3, known for sharp price accelerations, is a strong indicator of institutional buying. The wave invalidation level at 122,486 acts as a critical support—any movement below this point would invalidate the current bullish scenario.
The next anticipated move is Gray Wave 4, a moderate corrective phase before the continuation of the uptrend. Traders should closely monitor the performance of Gray Wave 3 while keeping 122,486 as a stop-loss threshold. The placement within Orange Wave 3 supports the outlook for continued gains and provides a tactical framework for identifying long trade setups.
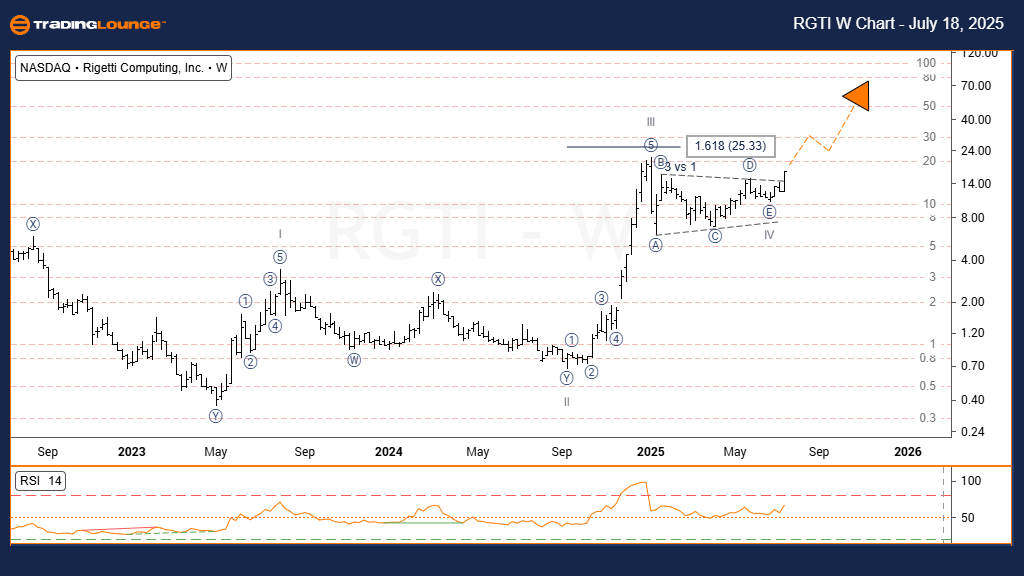
Bovespa Index Elliott Wave Analysis | Trading Lounge Weekly Chart
Bovespa Index Elliott Wave Technical Analysis
FUNCTION: Bullish Trend
MODE: Impulsive
STRUCTURE: Orange Wave 3
POSITION: Navy Blue Wave 1
DIRECTION NEXT LOWER DEGREES: Orange Wave 4
DETAILS: Orange Wave 2 has ended; Orange Wave 3 is underway.
Wave Cancel Invalidation Level: 122,486
The weekly Elliott Wave analysis of the Bovespa Index confirms a persistent bullish trend. The impulsive price action illustrates the formation of Orange Wave 3 within the broader Navy Blue Wave 1, marking a phase of rising momentum and price strength. Since Orange Wave 2 has concluded, the unfolding of Orange Wave 3 reflects robust market confidence and sustained buyer engagement.
The bullish case is supported by consistent higher highs, indicating strong institutional interest in Brazil's equity markets. The key invalidation level at 122,486 remains a vital benchmark. A decline below this point would require an immediate reevaluation of the bullish wave count.
Looking ahead, the market is likely to enter Orange Wave 4, a light corrective move before further upside. Traders should track the strength of Orange Wave 3 while managing exposure around the invalidation level. This multi-timeframe Elliott Wave structure provides a clear directional bias and supports a continued bullish trading outlook.
Technical Analyst: Malik Awais
Source: Visit Tradinglounge.com and learn from the Experts. Join TradingLounge Here
Previous: DAX Index Elliott Wave Technical Analysis
VALUE Offer - $1 for 2 Weeks then $29 a month!Click here
Access 7 Analysts Over 200 Markets Covered. Chat Room With Support