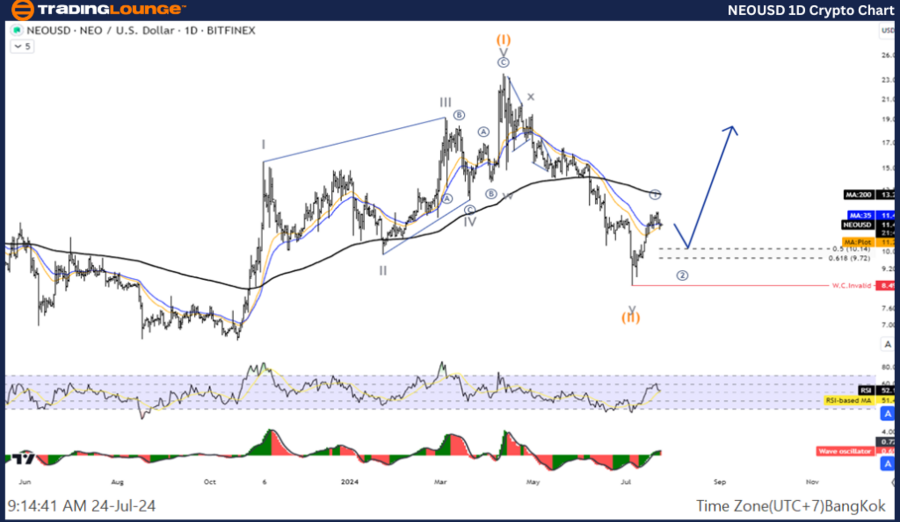
NEOUSD Elliott Wave Analysis - TradingLounge Daily Chart
NEO / U.S. Dollar (NEOUSD) Daily Chart Analysis
NEOUSD Elliott Wave Technical Analysis
Function: Counter Trend
Mode: Corrective
Structure: Double Corrective
Position: Wave Y
Direction Next Higher Degrees: Wave (II) of Impulse
Wave Cancel Invalid Level: 9.85
Details: The current analysis suggests that Wave (II) may have concluded, and the price is likely beginning an upward trend.
NEO / U.S. Dollar (NEOUSD) Trading Strategy:
Wave (II) in the NEOUSD pair is anticipated to finish around the 8.49 level, with the price expected to continue its upward movement. Traders should consider looking for entry points during short-term pullbacks to capitalize on this potential uptrend.
NEO / U.S. Dollar (NEOUSD) Technical Indicators: The price is currently below the 200-day moving average (MA200), indicating a general downtrend. However, the Wave Oscillator shows bullish momentum, suggesting potential upward movement.

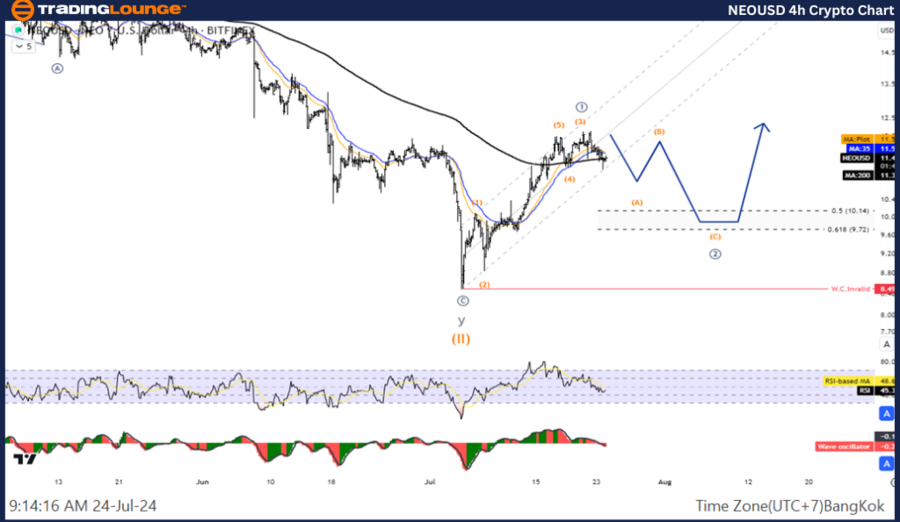
NEOUSD Elliott Wave Analysis - TradingLounge H4 Chart
NEO / U.S. Dollar (NEOUSD) 4-Hour Chart Analysis
NEOUSD Elliott Wave Technical Analysis
Function: Counter Trend
Mode: Corrective
Structure: Double Corrective
Position: Wave Y
Direction Next Higher Degrees: Wave (II) of Impulse
Wave Cancel Invalid Level: 9.85
Details: Similar to the daily chart analysis, Wave (II) appears to have reached its conclusion, indicating a possible resumption of the upward trend.
NEO / U.S. Dollar (NEOUSD) Trading Strategy:
The completion of Wave (II) around the 8.49 level signals potential for an uptrend. Investors and traders should seek opportunities to enter the market during minor corrections, aligning with the overall bullish outlook.
NEO / U.S. Dollar (NEOUSD) Technical Indicators: The price remains below the MA200, highlighting a longer-term downtrend. Nonetheless, the Wave Oscillator is exhibiting bullish signals, pointing towards a potential upward movement.
Technical Analyst: Kittiampon Somboonsod
Source: visit Tradinglounge.com and learn From the Experts Join TradingLounge Here
See Previous: Bitcoin / U.S. dollar (BTCUSD) Elliott Wave Technical Analysis
Special Trial Offer - 0.76 Cents a Day for 3 Months! Click here
Access 7 Analysts Over 170 Markets Covered. Chat Room With Support
