10Jan

ASX Northern Star Resources Ltd (NST) Elliott Wave Technical Analysis: Stock Forecast and Key Price Targets for Bullish Trends

Introduction to Elliott Wave Analysis for ASX: Northern Star Resources Ltd – NST 

Welcome to today’s Elliott Wave analysis of Northern Star Resources Ltd (ASX:NST). Our focus is to provide a detailed look into the bullish trend emerging for ASX:NST and guide traders on effective strategies to capitalize on this upward momentum.


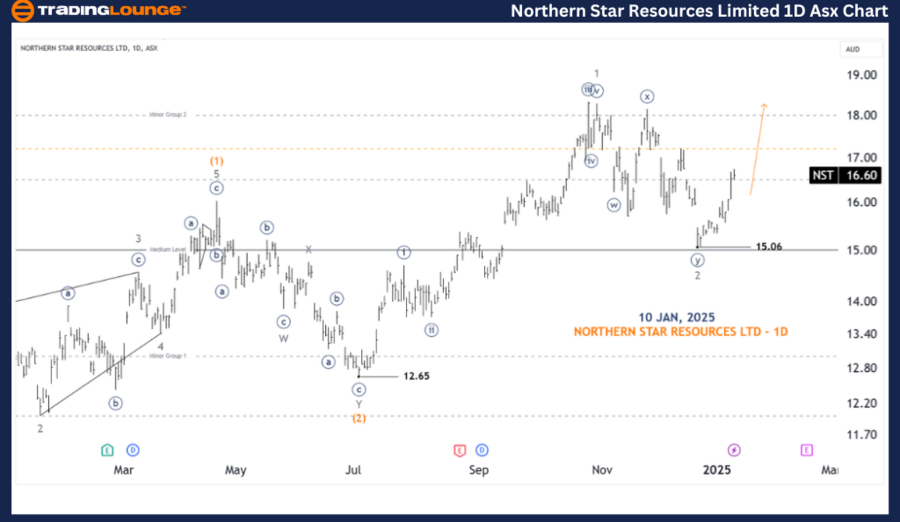
ASX: Northern Star Resources Ltd – NST 1D Chart Analysis (Semilog Scale)

Major Trend: Intermediate Degree (Orange)

  • Mode: Motive
  • Structure: Impulse
  • Position: Wave 3-grey of Wave (3)-orange

Analysis Details:

  • The price action confirms that Wave 2-grey concluded as a Double Zigzag, labeled as ((w))((x))((y))-navy, bottoming at 15.06.
  • The subsequent upward move signals the progression of Wave 3-grey, targeting the next milestone at 20.00.

Key Levels:

  • Invalidation Point: 15.06

NST-1d-asx-chart-100...


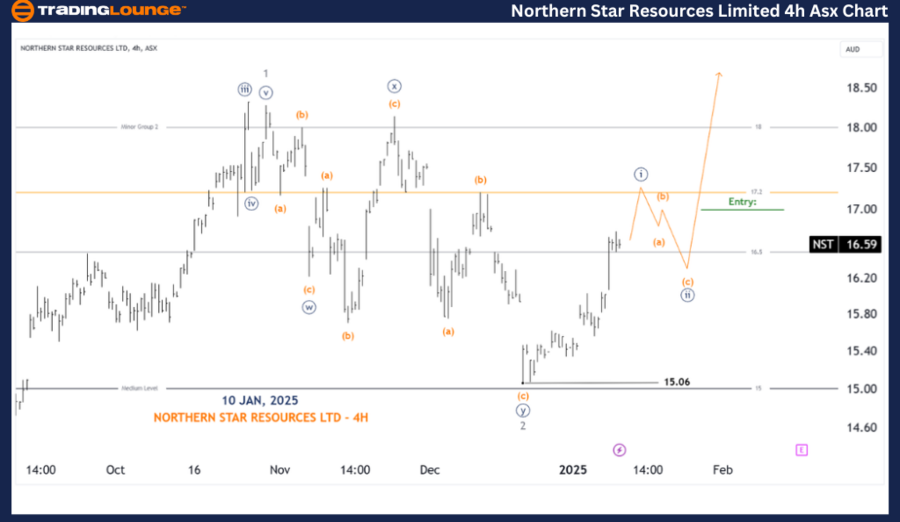
ASX: Northern Star Resources Ltd – NST 4-Hour Chart Analysis

Major Trend: Minute Degree (Navy)

  • Mode: Motive
  • Structure: Impulse
  • Position: Wave ((i))-navy of Wave 3-grey

Analysis Details:

  • A closer look at Wave 3-grey indicates that Wave ((i))-navy is nearing completion.
  • After this, a pullback in Wave ((ii))-navy is expected.
  • The optimal long trade setup arises when the price breaks above the endpoint of Wave (b)-orange within Wave ((ii))-navy. This ensures a safe entry point for bullish momentum.

Key Levels:

  • Invalidation Point: 15.06

Technical Analyst: Hua (Shane) Cuong, CEWA-M (Master’s Designation).

Source: visit Tradinglounge.com and learn From the Experts Join TradingLounge Here 

See Previous: COCHLEAR LIMITED - COH Elliott Wave Technical Analysis

VALUE Offer - Buy 1 Month & Get 3 Months!Click here

Access 7 Analysts Over 200 Markets Covered. Chat Room With Support

NST-4h-asx-chart-100...


Conclusion

This Elliott Wave analysis highlights the upward potential of Northern Star Resources Ltd (ASX:NST). By providing precise validation and invalidation levels, we aim to strengthen traders’ confidence in the current wave structure and trend forecast. Following our methodology can help you align your trading strategy with these critical market insights.

For long opportunities, the safest entry point lies above the key price level of Wave (b)-orange. By leveraging this strategic approach, traders can better position themselves to benefit from the bullish trend.

Related

Vanguard V300AEQ ETF UNITS – VAS Stock Analysis & Elliott Wave Technical Forecast

Vanguard V300AEQ ETF UNITS – VAS Stock Analysis & Elliott Wave Technical Forecast

Unlock the potential of your investments with our in-depth Elliott Wave analysis for ASX VAS ETF. Di...

Read More >
Grasim Industries Elliott Wave Forecast: Chart Analysis Shows Bullish Momentum and Strong Upside in Indian Stock Market

Grasim Industries Elliott Wave Forecast: Chart Analysis Shows Bullish Momentum and Strong Upside in Indian Stock Market

Grasim Industries shows a bullish Elliott Wave pattern on both daily and weekly charts, forecasting ...

Read More >
BTCUSD Elliott Wave Analysis: Bitcoin Price Prediction, Trading Strategy, Support & Resistance Levels, and Crypto Market Trends

BTCUSD Elliott Wave Analysis: Bitcoin Price Prediction, Trading Strategy, Support & Resistance Levels, and Crypto Market Trends

Bitcoin Elliott Wave Forecast with detailed BTCUSD price analysis. Our BTC/USD trading strategy expl...

Read More >
XRP/U.S. dollar(XRPUSD) Elliott Wave Technical Analysis 13 December 23

XRP/U.S. dollar(XRPUSD) Elliott Wave Technical Analysis 13 December 23

XRP/U.S. dollar(XRPUSD) Elliott Wave Technical Analysis dated 13 December 23, with day chart and 4-h...

Read More >
Achieving ASX Trading Success: AMCOR PLC (AMC) Stock Insights and Elliott Wave Technical Analysis

Achieving ASX Trading Success: AMCOR PLC (AMC) Stock Insights and Elliott Wave Technical Analysis

Get an in-depth analysis of AMCOR PLC (AMC) with Elliott Wave insights, ASX stock forecasts, and tra...

Read More >
Commodity Market Elliott Wave Analysis: Bitcoin, Ethereum, Bonds, Yields, Gold, Silver, Copper, Uranium, Crude Oil, Natural Gas

Commodity Market Elliott Wave Analysis: Bitcoin, Ethereum, Bonds, Yields, Gold, Silver, Copper, Uranium, Crude Oil, Natural Gas

Bitcoin and Ethereum are expected to climb higher. TLT Bonds and US 10 Yr. Yields suggest a potentia...

Read More >

$1 for 2 Weeks

then $29 a month!

What a Special Offer!

Trade Recommendations

Unleash the power of deversified trading with our comprehensive portfolio, covering 250+ markets:

  • Stock Trades
  • Crypto Trades
  • Forex Trades
  • Commodity Trades
Elliott Wave Analysis

Gain a competitive edge with expert insights and AI-powered Elliott Wave charting into:

  • Global Indices
  • US Stocks & ASX Stocks
  • Forex & Crypto
  • Commodities
Top-Notch Trading Tools

Equip yourself with the tools of success:

  • Real-time Chat rooms
  • Elliott Wave Algorithm
  • Portfolio tools
  • TradingLevels
  • Screener
  • Trading Game
7 Elliott Wave Analysts

Stay ahead of the market with daily charts and insightful videos
Your secret to strategic trading!

JOIN HERE


Welcome to TradingLounge (ASIC A.R.No. 321187), specialists in trades, trading education and technical analysis, covering stocks, indices, commodities, forex and cryptocurrencies.

When you join TradingLounge you have access to everything we offer, including trade tools, educational content and a social platform to chat with like-minded investors.

Read more

@Copyright 2024 by tradinglounge.com

Contact Us

Australian no: 02 4787 6020

International no: +61 (2) 47876020

Pay with:

Find us on