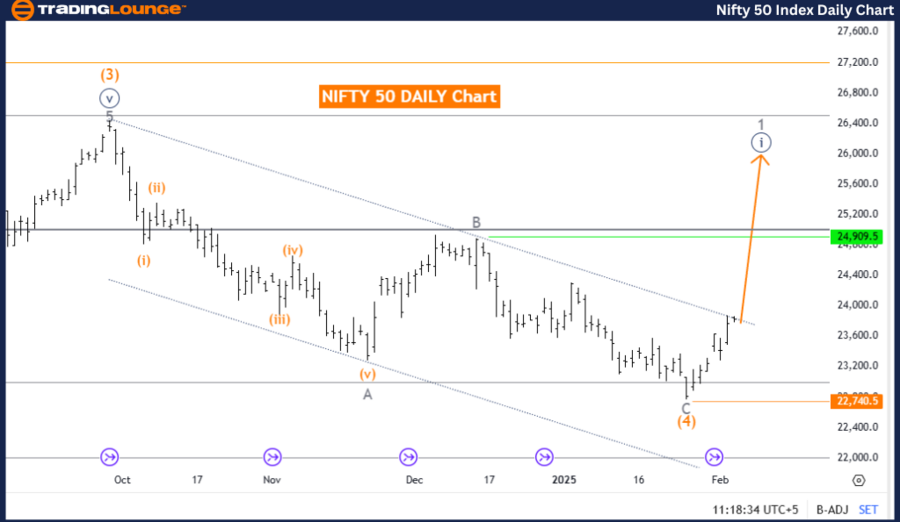
NIFTY 50 (INDIA) Elliott Wave Analysis – Trading Lounge Day Chart
NIFTY 50 Index Day Chart Analysis
NIFTY 50 (INDIA) Elliott Wave Technical Analysis
Function: Bullish Trend
Mode: Impulsive
Structure: Navy Blue Wave 1
Position: Gray Wave 1
Next Higher Degree Direction: Navy Blue Wave 1 (Initiated)
Details:
- Orange Wave 4 appears to be completed.
- Navy Blue Wave 1 of 1 is now developing, indicating a fresh uptrend.
Wave Cancel Invalidation Level: 22,740.5
NIFTY 50 Index Market Overview
The NIFTY 50 daily chart, evaluated using Elliott Wave Theory, suggests a bullish trend with an impulsive wave structure. The Navy Blue Wave 1 has initiated, signaling the beginning of a potential long-term uptrend. Currently, Gray Wave 1 is active, contributing to the market’s upward momentum.
The completion of Orange Wave 4 has allowed for the emergence of Navy Blue Wave 1 of 1, strengthening bullish sentiment and indicating the potential for further price appreciation in the upcoming trading sessions.
NIFTY 50 Technical Insights
Conclusion
The NIFTY 50 daily chart projects a bullish scenario, with Navy Blue Wave 1 of 1 unfolding within an emerging uptrend. The completion of Orange Wave 4 sets a strong foundation for continued gains.
Traders and investors should remain attentive to price trends and market momentum, while carefully watching the invalidation level to confirm or adjust trading strategies in response to market dynamics.
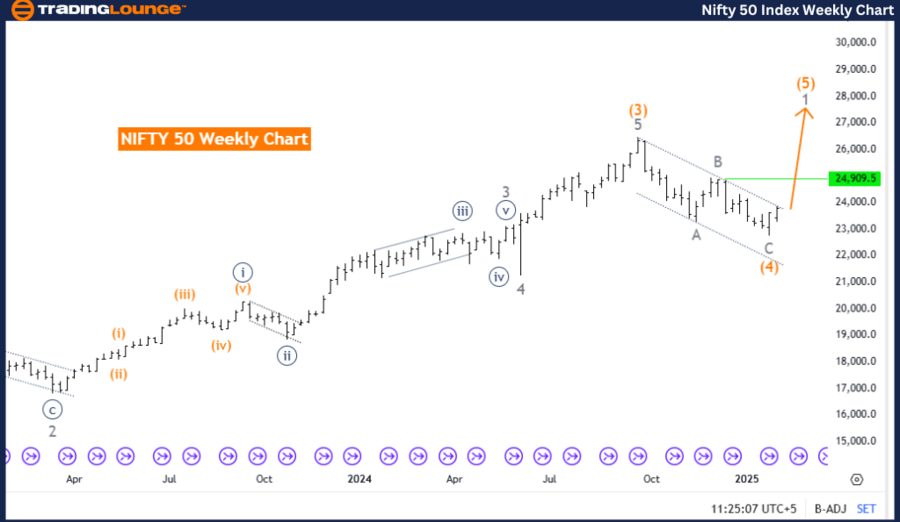
NIFTY 50 (INDIA) Elliott Wave Analysis – Trading Lounge Weekly Chart
NIFTY 50 (INDIA) Elliott Wave Technical Analysis
Function: Bullish Trend
Mode: Impulsive
Structure: Gray Wave 1
Position: Orange Wave 5
Next Higher Degree Direction: Gray Wave 1 (Initiated)
Details:
- Orange Wave 4 appears completed.
- Gray Wave 1 of 5 is now forming as a new bullish wave.
Wave Cancel Invalidation Level: 22,740.5
NIFTY 50 Index Market Overview
The NIFTY 50 weekly chart, assessed through Elliott Wave Theory, maintains a bullish outlook with an impulsive wave structure. Gray Wave 1 has recently started, signaling the beginning of a potential long-term uptrend. Currently, Orange Wave 5 is in play, further reinforcing market strength.
The completion of Orange Wave 4 has paved the way for Gray Wave 1 of 5, which suggests renewed momentum and the potential for further price growth. The initiation of Gray Wave 1 underlines the positive market sentiment and supports continued price gains in the upcoming sessions.
NIFTY 50 Index Technical Insights
Conclusion
The NIFTY 50 weekly chart indicates a bullish market phase, with Gray Wave 1 of 5 actively unfolding. The completion of Orange Wave 4 strengthens price recovery, providing a solid foundation for further upside movement.
Market participants should closely monitor price behavior and trend developments, ensuring alignment with the ongoing bullish momentum. Keeping an eye on the critical invalidation level at 22,740.5 will be essential for adjusting trading strategies accordingly.
Technical Analyst: Malik Awais
Source: visit Tradinglounge.com and learn From the Experts Join TradingLounge Here
Previous: Shanghai Composite Elliott Wave Technical Analysis
VALUE Offer - Buy 1 Month & Get 3 Months!Click here
Access 7 Analysts Over 200 Markets Covered. Chat Room With Support