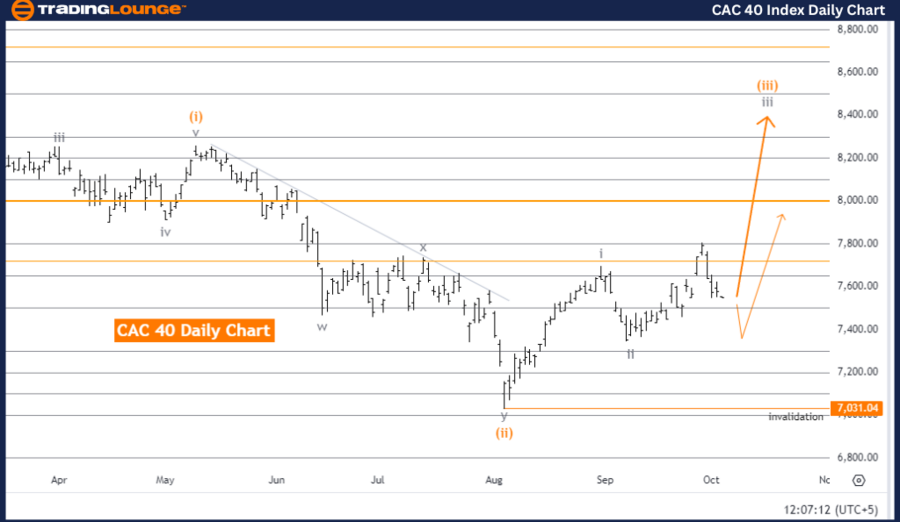
CAC 40 (France) Elliott Wave Analysis Tradinglounge - Day Chart
CAC 40 France Market Analysis
CAC 40 (France) Elliott Wave Technical Analysis
Function: Bullish Trend
Mode: Impulsive
Structure: Gray wave 3
Position: Orange wave 3
Direction:
Next Higher Degrees: Gray wave 3 (potentially started)
Details: Gray wave 2 appears to have completed. Gray wave 3 of orange wave 3 is now unfolding.
Wave Cancel Invalid Level: 7,031.04
The Elliott Wave analysis for the CAC 40 daily chart reveals a bullish trend, suggesting upward momentum in the market. The mode of movement is classified as impulsive, indicating a strong advance aligned with the overall bullish structure. The wave currently under analysis is gray wave 3, a part of a broader bullish pattern.
At this stage, the market is positioned in orange wave 3 within the larger gray wave 3 structure. Gray wave 2 is considered complete, and gray wave 3 of orange wave 3 is now unfolding.
According to Elliott Wave Theory, wave 3 tends to be the strongest and most extended within an impulsive sequence. This signals a strong upward trajectory, with the market likely to experience continued gains as the bullish trend progresses. The completion of gray wave 2 signifies the end of the previous corrective phase, setting the stage for a new, stronger impulsive move upward.
It is likely that gray wave 3 has already started, reinforcing the market's bullish trend. The next significant movement is expected to be gray wave 3 of a higher degree, suggesting continued upward momentum.
The critical invalidation level to monitor is 7,031.04. Should the market fall below this level, the current Elliott Wave analysis would be invalidated, requiring a reevaluation of the wave structure. This is a key level in determining whether the bullish outlook remains intact.
Summary:
The Elliott Wave analysis for the CAC 40 daily chart indicates a bullish trend, with both gray wave 3 and orange wave 3 actively developing. Traders should monitor the invalidation level of 7,031.04 to confirm the continuation of the upward trend. As gray wave 3 progresses, the market is expected to maintain its bullish momentum, signaling potential further gains.
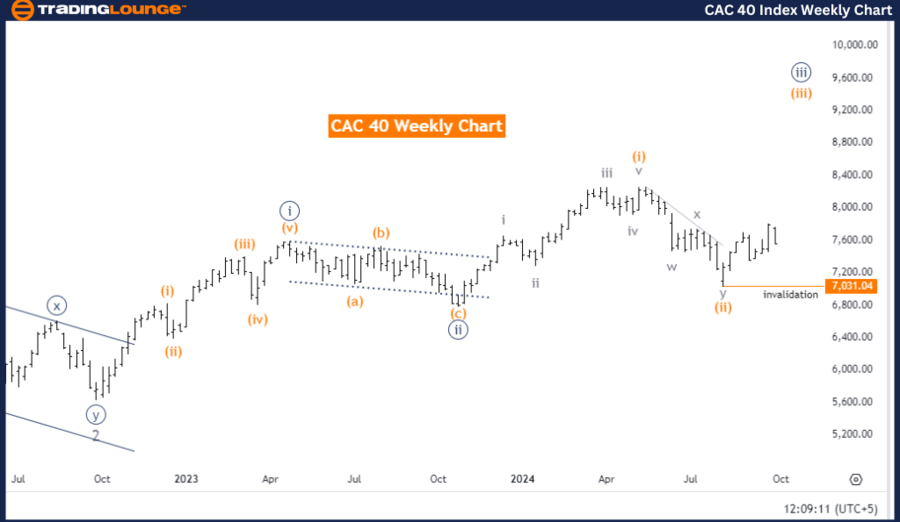
CAC 40 (France) Elliott Wave Analysis - Weekly Chart
CAC 40 (France) Elliott Wave Technical Analysis
Function: Bullish Trend
Mode: Impulsive
Structure: Orange wave 3
Position: Navy blue wave 3
Direction
Next Higher Degrees: Orange wave 3 (in progress)
Details: Orange wave 2 has completed, and orange wave 3 of orange wave 3 is now advancing.
Wave Cancel Invalid Level: 7,031.04
The Elliott Wave analysis for the CAC 40 weekly chart suggests a bullish trend, pointing to continued upward momentum in the market. The mode is impulsive, indicating that the market is advancing strongly in line with the primary bullish trend. The wave structure currently under consideration is orange wave 3, part of a larger impulsive sequence.
At this point, the market is positioned in navy blue wave 3, which is part of the broader orange wave 3 structure. The completion of orange wave 2 has occurred, and now orange wave 3 of orange wave 3 is advancing. In Elliott Wave Theory, wave 3 is typically the most powerful and extended in an impulsive sequence, suggesting that the market is likely to experience continued gains as the bullish trend strengthens.
The analysis confirms that orange wave 3 has begun, indicating that the market is in the early stages of a significant rally. Since wave 3 tends to be the strongest phase of an impulsive movement, this stage is expected to deliver substantial market gains.
The critical invalidation level to monitor is 7,031.04. If the market drops below this level, the current Elliott Wave analysis will be invalid, requiring a reassessment of the wave structure. Monitoring this level is crucial for confirming the continuation of the bullish trend.
Summary:
The Elliott Wave analysis for the CAC 40 weekly chart indicates a strong bullish trend, with orange wave 3 and navy blue wave 3 in progress. The market is expected to maintain its upward trajectory, driven by the powerful impulsive structure of wave 3. Traders should closely monitor the invalidation level of 7,031.04 to confirm the ongoing bullish trend.
Technical Analyst: Malik Awais
Source: visit Tradinglounge.com and learn From the Experts Join TradingLounge Here
Previous: Swiss Market Index Elliott Wave Technical Analysis
VALUE Offer - Buy 1 Month & Get 3 Months!Click here
Access 7 Analysts Over 200 Markets Covered. Chat Room With Support