TRXUSD Elliott Wave Analysis TradingLounge Daily Chart

In this detailed Elliott Wave analysis of the Tron/US dollar (TRXUSD) trading pair, we aim to provide traders with an in-depth look into the current trends and potential future movements based on both daily and H4 charts. By breaking down the wave structures and examining technical indicators, this analysis will serve as a valuable tool for those looking to leverage the Elliott Wave theory in their trading strategy.

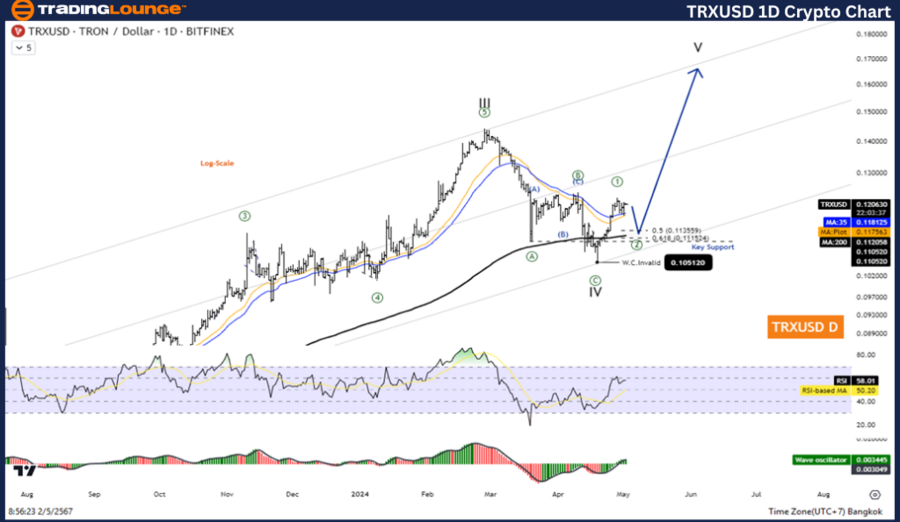
Tron/ U.S. dollar(TRXUSD) Daily Chart Analysis

TRXUSD Elliott Wave Technical Analysis

Function: Counter trend    

Mode: Corrective

Structure: Zigzag

Position:  Wave ((C))

Direction Next higher Degrees: wave I of Impulse

Wave Cancel invalid Level: 

Details: Wave IV  may be complete and the price increase again in Wave V.

Tron/ U.S. dollar(TRXUSD)Trading Strategy:
Tron's fourth wave correction appears to be complete at the level. 0.1051 and the price is rising again in the fifth wave. But there may be a correction in wave 2 of the fifth wave before increasing. Therefore, the overall price is entering the trend again. Looking for opportunities to open long positions.

Tron/ U.S. dollar(TRXUSD)Technical Indicators: The price is above the MA200 indicating an uptrend, The Wave Oscillator is a Bullish Momentum.

TRXUSD-1D-crypto-cha...


TRXUSD Elliott Wave Analysis TradingLounge H4 Chart 

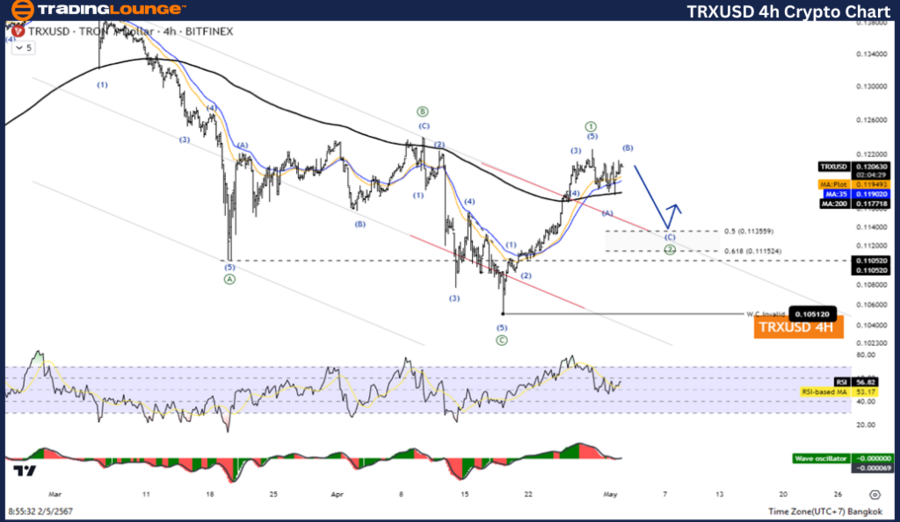
Tron/ U.S. dollar(TRXUSD) H4 Chart Analysis

TRXUSD Elliott Wave Technical Analysis

Function: Counter trend    

Mode: Corrective

Structure: Zigzag

Position:  Wave ((C))

Direction Next higher Degrees: wave I of Impulse

Wave Cancel invalid Level: 

Details: Wave IV  may be complete and the price increase again in Wave V.

Tron/ U.S. dollar(TRXUSD)Trading Strategy:
Tron's fourth wave correction appears to be complete at the level. 0.1051 and the price is rising again in the fifth wave. But there may be a correction in wave 2 of the fifth wave before increasing. Therefore, the overall price is entering the trend again. Looking for opportunities to open long positions.

Tron/ U.S. dollar(TRXUSD)Technical Indicators: The price is above the MA200 indicating an uptrend, The Wave Oscillator is a Bullish Momentum.

Technical Analyst: Kittiampon Somboonsod

Source: visit Tradinglounge.com and learn From the Experts Join TradingLounge Here 

Previous: Pokadot/ U.S. dollar(DOTUSD) Chart Analysis

Special Trial Offer - 0.76 Cents a Day for 3 Months! Click here

Access 6 Analysts covering over 150 Markets. Chat Room With Support

TRXUSD-4h-crypto-cha...

Conclusion

The TRXUSD pair exhibits a clear zigzag corrective structure on both daily and H4 charts, suggesting a temporary counter-trend before a likely continuation of the main bullish trend. With Wave IV completed and Wave V in progress, the trading strategy focuses on long positions, particularly after the brief correction in Wave 2 of Wave V. Technical indicators like the MA200 and the Wave Oscillator reinforce the bullish outlook, making it an opportune time for traders to engage with the market.

Related

Understand the key Signals and Patterns in Gold's Market Movement: Gold (XAUUSD) Commodity Elliott Wave Analysis

Understand the key Signals and Patterns in Gold's Market Movement: Gold (XAUUSD) Commodity Elliott Wave Analysis

This article provides a comprehensive Gold Elliott Wave analysis, covering gold price predictions, m...

Read More >
WTI Elliott Wave Analysis Revealing Crude Oil Price Trends, Key Support Levels, Bearish Breakouts, and Technical Outlook

WTI Elliott Wave Analysis Revealing Crude Oil Price Trends, Key Support Levels, Bearish Breakouts, and Technical Outlook

This analysis delves into WTI crude oil price movements using Elliott Wave theory. It highlights the...

Read More >
U.S. Dollar / Japanese Yen Elliott Wave Technical Analysis: Perfect for Forex Traders Seeking Insights into USDJPY Price Movements

U.S. Dollar / Japanese Yen Elliott Wave Technical Analysis: Perfect for Forex Traders Seeking Insights into USDJPY Price Movements

Discover the latest USDJPY Elliott Wave analysis focusing on daily and 4-hour charts. This comprehen...

Read More >
Elliott Wave Analysis on ASX Stock RIO Tinto (RIO) Provides Investors with a Detailed Look at Current Trends and Trading Strategies

Elliott Wave Analysis on ASX Stock RIO Tinto (RIO) Provides Investors with a Detailed Look at Current Trends and Trading Strategies

Our comprehensive Elliott Wave analysis on ASX: RIO Tinto (RIO) provides investors with a detailed l...

Read More >
U.S. Dollar/Swiss Franc (USDCHF) Forex Elliott Wave Technical Analysis for both day and 4-hour charts

U.S. Dollar/Swiss Franc (USDCHF) Forex Elliott Wave Technical Analysis for both day and 4-hour charts

This article provides an in-depth USDCHF Elliott Wave analysis for both day and 4-hour charts. It co...

Read More >

Buy 1 Month

Get 3 Months!

Special Offer:

Trade Recommendations

Unleash the power of deversified trading with our comprehensive portfolio, covering:

  • Stock Trades
  • Crypto Trades
  • Forex Trades
  • Commodity Trades
Elliott Wave Analysis

Gain a competive edge with expert insights in to:

  • Global Indices
  • US Stocks & ASX Stocks
  • Forex & Crypto
  • Commodities
Top-Notch Trading Tools

Equip yourself with the tools of success:

  • Social Chat
  • Elliott Wave Algorithm
  • Screener
  • TradingLevels
  • Trading Game
7 Elliott Wave Analysts

Stay ahead of the market with daily charts and insightful videos
-Your secret to strategic trading!

JOIN HERE


Welcome to TradingLounge (ASIC A.R.No. 321187), specialists in trades, trading education and technical analysis, covering stocks, indices, commodities, forex and cryptocurrencies.

When you join TradingLounge you have access to everything we offer, including trade tools, educational content and a social platform to chat with like-minded investors.

Read more

@Copyright 2024 by tradinglounge.com

Contact Us

Australian no: 02 4787 6020

International no: +61 (2) 47876020

Pay with:

Find us on